A soil test reveals exactly what your lawn needs to thrive. This guide explains how to read and interpret your soil test report so you can apply the proper nutrients in the right amounts, with no guesswork required.
I hold a master’s degree in soil fertility and have run thousands of soil tests throughout my career. I understand what each number in a soil test report means and how to use that data effectively, so let’s get started.
| Need expert help reading your soil test? LawnStarter’s lawn treatment professionals can interpret your results and create a custom fertilization plan for your yard. |
| Key Takeaways: |
|---|
| • Ideal lawn pH range: 6.0 to 7.0. • Apply lime to raise soil pH levels. • Add sulfur to lower the soil pH. |
What is a Soil Test, and Why is it Important?
A soil test analyzes your soil’s chemical makeup and reveals what nutrients are available for your grass to absorb, along with soil pH, organic matter, and soluble salts. Think of it like getting bloodwork done at your annual physical. The report shows you exactly what’s happening underground.
Without soil testing, you’re fertilizing blindly. You might be overapplying nutrients or failing to address deficiencies, which can cause yellowing grass, patchy growth, or poor root development.
For a detailed look at why regular soil testing matters, read: 9 Reasons Why Soil Testing Is Important for the Lawn.
How to Read Your Soil Test Report
Soil test report formats typically vary by lab, but they generally include the same information. Here’s how to interpret each section and use the data to improve your lawn.
Soil pH
Soil pH is important for plant health. It measures the hydrogen ions (H+) in your soil and controls how well your grass can access nutrients. The pH scale runs from 0 to 14, with 7.0 being neutral.
Target pH for lawns is 6.0 to 7.0 (slightly acidic to neutral). When pH strays too far from the target range, nutrients can become locked in the soil, even if they’re present, or become available at toxic levels.
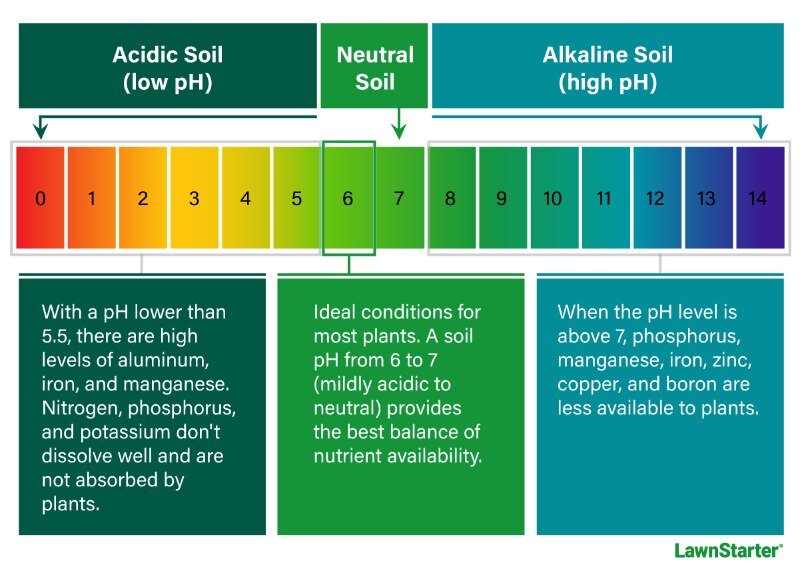
Important: pH operates on a logarithmic scale. A pH of 6.0 is ten times more acidic than 7.0, and one hundred times more acidic than 8.0.
Adjusting Your Soil pH
Your soil test report specifies how many pounds of amendment to apply per acre (or per 1,000 square feet for residential lawns) to change your soil pH:
- To raise pH, apply lime.
- To lower pH, apply sulfur.
Mix amendments into the soil when possible to speed the reaction. Plan to retest your soil every 6 to 12 months after adjusting pH to confirm it has stabilized.
Bryan Hopkins, professor at Brigham Young University, explains that adjusting soil pH is much more beneficial for acid soils than alkaline soils:
“Raising the pH of acid soils below pH 6 to between 6-7 is recommended. Lowering the pH of alkaline soils (above pH 7) is not generally feasible because of the high concentrations of carbonates in soils and irrigation water, or needed, but rather application of fertilizer is sufficient.”
My Experience: My soil has an unamended pH of about 8.2 to 8.4. I don’t try to adjust the lawn’s pH. I just add fertilizer and see fantastic growth. I will put some sulfur down in the garden, though, especially for my tomatoes and raspberries.
See Related:
- How to Use a Soil Test Kit
- When to Test the Soil pH of Your Lawn
- 5 Signs of Acidic Soil in Your Lawn (Low pH)
- 5 Signs of Alkaline Soil in Your Lawn (High pH)
Plant Essential Nutrients
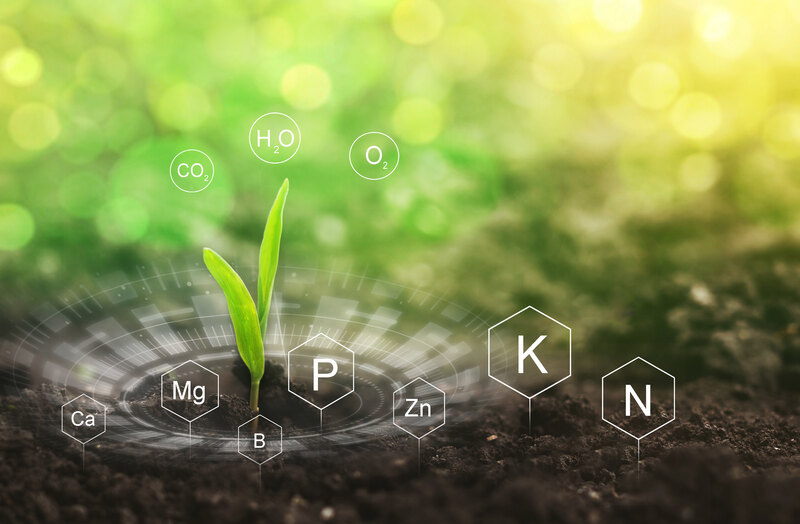
Your grass needs 17 essential nutrients to grow strong and healthy. Soil tests measure 14 of these nutrients (sans carbon, hydrogen, and oxygen) to show what’s available for plant uptake.
Primary Nutrients (Macronutrients)
These nutrients are needed in the largest amounts:
- Nitrogen (N) drives leaf growth and green color.
- Phosphorus (P) is essential for root development and energy transfer.
- Potassium (K) strengthens stress tolerance and disease resistance.
Secondary Nutrients
Still needed in significant amounts:
- Magnesium (Mg) is central to chlorophyll production.
- Calcium (Ca) builds cell walls and improves soil structure.
- Sulfur (S) is required for protein synthesis and nitrogen uptake.
Micronutrients
Needed in trace amounts but equally essential:
- Boron (B) supports cell division.
- Zinc (Zn) activates enzymes and aids growth.
- Iron (Fe) is critical for chlorophyll formation.
- Manganese (Mn) is involved in photosynthesis.
- Chlorine (Cl) helps water movement in plants.
- Copper (Cu) activates enzymes.
- Molybdenum (Mo) is needed for nitrogen processing.
- Nickel (Ni) helps plants use nitrogen efficiently.
Your soil test report shows nutrient levels as parts per million (ppm) or pounds per acre (lbs/acre). Use this table to compare your results to optimal ranges:
| Nutrient | Chemical symbol | Average amount measured in ppm | Average amount measured in lbs/acre |
| Nitrogen | N (may be listed as NO3, the form used by plants) | 25 – 30 | 50 – 60 |
| Phosphorus | P | 25 – 35 | 50 – 70 |
| Potassium | K | 165 – 220 | 330 – 440 |
| Magnesium | Mg | 100 or higher | 200 or higher |
| Calcium | Ca | 1,400 or higher | 2,800 or higher |
| Sulfur | S | 7 – 15 | 14 – 30 |
| Boron | B | 0.3 – 0.5 | 0.6 – 1 |
| Zinc | Zn | 1 – 3 | 2 – 6 |
| Iron | Fe | 10 – 20 | 20 – 40 |
| Manganese | Mn | 8 – 11 | 16 – 22 |
| Chlorine | Cl | 15 – 30 | 30 – 60 |
| Copper | Cu | 0.8 – 1 | 1.6 – 2 |
| Molybdenum | Mo | 0.25 – 5 | 0.5 – 10 |
| Nickel | Ni | 1 – 20 | 2 – 40 |
Note: Your report may also list sodium (Na), which isn’t essential to plants but can indicate salt levels that could damage your lawn.
Interpreting Micronutrient Results
Most soil test reports classify micronutrient levels as “low,” “medium,” “optimal,” or “high” using bar graphs or tables rather than providing numerical values. This qualitative approach is more useful because micronutrient availability is heavily influenced by soil pH.
Remember, when soil pH is too high or too low, micronutrients become chemically bound in forms plants can’t absorb — even if they’re present in adequate amounts.
The first step in fixing micronutrient problems is always to adjust the pH. If your soil test shows micronutrient deficiencies and your pH is outside the 6.0 to 7.0 range, adjust pH first. In many cases, bringing pH into the optimal range makes micronutrients more available and resolves deficiency symptoms without needing additional fertilizer.
Only apply micronutrients if your report specifically recommends it. This indicates a severe deficiency that won’t be corrected by pH adjustment alone. Don’t add micronutrients based on visual symptoms or guesswork — excess micronutrients can be toxic to grass and create imbalances with other nutrients.
Correcting Nutrient Deficiencies
When your soil test shows nutrient deficiencies, the report provides application rates in pounds per acre or pounds per 1,000 square feet. Use these recommendations to select fertilizers that address your specific needs.
See Related:
- Fertilizer Numbers: What They Mean and How to Use Them
- 7 Common Fertilizer Mistakes to Avoid
- Organic vs. Synthetic Fertilizer: What’s the Difference?
- Slow-Release vs. Quick-Release Fertilizer
- Liquid vs. Granular Fertilizer
Organic Matter (OM)

Organic matter represents all biological material in your soil — decomposing leaves, grass clippings, dead roots, and living microorganisms.
The ideal OM range is 4% to 6%.
Higher organic matter improves:
- Soil structure and water infiltration
- Water retention during dry periods
- Nutrient-holding capacity (cation exchange capacity)
- Beneficial microbial activity
Low organic matter (below 3%) means your soil struggles to hold water and nutrients. To gradually increase organic matter, add compost, leave grass clippings on your lawn, and avoid removing all fallen leaves.
Related:
Cation Exchange Capacity (CEC)
Cation exchange capacity measures your soil’s ability to hold and supply positively charged nutrients like calcium, magnesium, potassium, and many micronutrients.
What the numbers mean:
- Higher CEC = better nutrient storage
- Lower CEC = nutrients wash away more easily
CEC is expressed as milliequivalents per 100 grams of soil (meq/100 g). Compare your results to typical ranges by soil type:
| Soil type | Typical CEC at soil pH of 7.0 (meq/100 g) |
| Sandy soils | 1 – 5 |
| Sandy loam soils | 5 – 10 |
| Loam soils | 5 – 15 |
| Silt soils | 15 – 25 |
| Clay loam soils | 15 – 30 |
| Clay soils | More than 30 |
Note: Soil pH directly affects CEC readings. In acidic soils with low CEC, raising the pH typically increases CEC as H+ (the hydrogen ions that contribute to acidic soil pH) are displaced by nutrient-holding calcium and magnesium from lime. Conversely, acidic conditions lower CEC because hydrogen ions occupy exchange sites that would otherwise hold nutrients.
Base Saturation
Base saturation shows the percentage of your soil’s cation exchange sites occupied by “base” cations: calcium, magnesium, potassium, and sodium.
Higher base saturation generally indicates fertile, productive soil with balanced nutrient levels and lower acidity.
Some soil test reports display this as a single “base saturation” percentage, while others break it down by individual nutrients.
Ideal base saturation ranges:
| Base cations | Ideal base saturation in soil |
| Calcium | 65% – 80% |
| Magnesium | 12% – 25% |
| Potassium | 4% – 8% |
| Sodium | Less than 1% |
When base saturation is low, it typically means acidic cations (hydrogen and aluminum) occupy most exchange sites. Add lime to raise pH and naturally increase base saturation.
Soluble Salts (Salinity)
Your soil test may include a “soluble salts” or “EC” (electrical conductivity) section, especially in coastal areas or dry climates where salts accumulate.
Measurements appear as millimhos per centimeter (mmhos/cm) or deciSiemens per meter (dS/m):
- Optimal: 0.8 mmhos/cm (or dS/m) or below
- Problematic: Above 4 mmhos/cm
High soluble salt concentrations create water stress — even when soil is moist, grass can’t absorb water because salt disrupts the osmotic balance. Only salt-tolerant grass species survive in highly saline conditions.
Sodic soil conditions occur when sodium levels are too high:
- Sodium levels reach 160 ppm or greater
- Sodium base saturation exceeds 1%
Sodic soils have poor structure, which restricts root growth. Heavy irrigation (leaching) can flush salts deeper into the soil, but this isn’t practical for most homeowners and can contaminate groundwater.
FAQ About Soil Testing and Soil Test Reports
Test every 3 to 4 years when soil pH is optimal. If you recently adjusted pH, wait 6 months, and then test every 1 to 2 years until it stabilizes. If your lawn shows yellowing, patchy areas, or poor growth, test immediately to diagnose the problem. You should also test before planting a new lawn, reseeding, post-construction, or if making significant landscaping changes.
Test in fall before winter dormancy or early spring before grass begins active growth. Avoid testing right after applying fertilizer, lime, or compost. Wait at least 6 to 8 weeks for accurate results.
Yes. A soil test identifies nutrient deficiencies, pH imbalances, and excess salt levels that cause patchy growth. Compare a sample from the problem area to a sample from a healthy area to pinpoint the difference.
Send samples to a professional lab (or use your local Cooperative Extension office) for the most accurate results and detailed recommendations. Lab testing costs $10 to $20 for basic tests and $40 to $75 for comprehensive soil analysis. Results take 1 to 3 weeks but include precise measurements and fertilizer recommendations based on your grass type and region.
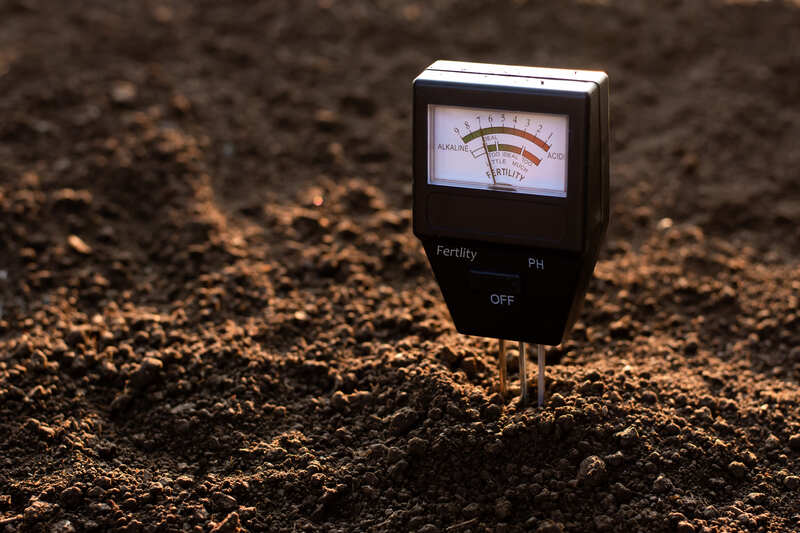
DIY test kits cost under $20 and provide results in minutes, but they’re less accurate and don’t include professional recommendations.
Trust Your Lawn Care to Professionals
Understanding your soil test report is the foundation of a healthy lawn. With these insights, you can apply exactly what your grass needs — no more, no less — for thicker, greener growth all season long.
Ready to put your soil test to work? Contact LawnStarter to connect with a local fertilization professional who can create a custom fertilization plan for your yard. Our pros handle everything from mowing to weed control and seasonal maintenance — so you can enjoy a beautiful lawn without the hassle.
Sources:
- Bryan Hopkins, professor and Certified Professional Soil Scientist at Brigham Young University, Provo, UT. Personal interview.
- “Cation Exchange Capacity and Base Saturation.” By Uttam K. Saha, program coordinator, Agricultural & Environmental Services Lab (AESL). UGA Cooperative Extension.
- “Soil Organic Matter.” By Megan Fenton, Carl Albers, and Quirine Ketterings. Cornell University Cooperative Extension.
- “Understanding Soil pH.” By Mary Jo Gibson, Master Gardener. Penn State Extension.
Main Image: Scientist performing a soil test in laboratory. Image Credit: New Africa / Adobe Stock