
Some cities help residents slow down with green space, low congestion, and supportive community amenities, which is so important, especially during the hustle and bustle of the holiday season.
To help you find a little more calm, LawnStarter ranked America’s Most Relaxed Cities. We compared the 500 biggest U.S. cities across 7 categories, including mental health, sleep, commute times, finances, and access to outdoor and wellness amenities, among 42 metrics.
Curious if your city sets the pace for calm? Explore the full ranking below and unwind with our methodology to see how this study story came together.
Why is LawnStarter ranking the Most Relaxed Cities? Our front yards welcome us home from stressful commutes and our backyards often are an oasis of calm amid everyday life.
A little later, you’ll learn how some of our lawn mowing pros relax – proof that you can find your own calm wherever you live.
Contents
- Most Relaxed City Rankings
- Spotlight: Most Relaxed Cities Close Up
- Key Insights
- Off the Clock With LawnStarter Pros
- Ask the Experts
- Methodology
- Final Thoughts: Everyday Calm Outdoors
Most Relaxed City Rankings
Settle in and slow down. These cities rose to the top for low-stress living in 2026.
Use the tabs above the table to switch between large, midsize, and small cities for fair comparisons.
City Size Definitions:
- Large: 250,000+ population
- Midsize: 100,000 to 249,000 population
- Small: Under 100,000 population
- Total cities ranked: Large (91), Midsize (236), Small (173)

Illustration Credit: Aris Berroya
Spotlight: Most Relaxed Cities Close Up
Check out the slideshow below for highlights on each of our 3 most relaxed cities from each population group.
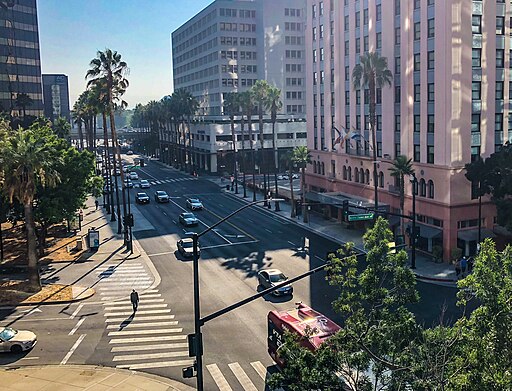
Overall Score: 62.04 | Population: ~990,000
San Jose’s rankings by category among large cities, 250,000+ population:
Mental Well-Being Rank: 3rd
Physical Well-Being Rank: 1st
Financial Well-Being Rank: 6th
Work Stressors Rank: 50th
Environmental Stressors Rank: 3rd
Social Stressors Rank: 17th
Recreation Options Rank: 36th
Photo Credit: Will Buckner / Wikimedia Commons / License

Overall Score: 61.15 | Population: ~836,500
San Francisco’s rankings by category among large cities, 250,000+ population:
Mental Well-Being Rank: 1st
Physical Well-Being Rank: 22nd
Financial Well-Being Rank: 11th
Work Stressors Rank: 76th
Environmental Stressors Rank: 2nd
Social Stressors Rank: 29th
Recreation Options Rank: 2nd
Photo Credit: Tierney / Adobe Stock / License
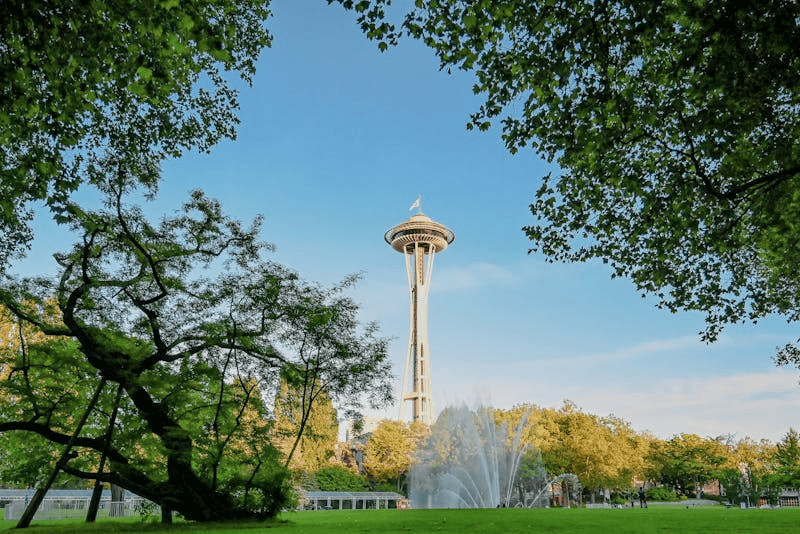
Overall Score: 60.67 | Population: ~741,500
Seattle’s rankings by category among large cities, 250,000+ population:
Mental Well-Being Rank: 11th
Physical Well-Being Rank: 3rd
Financial Well-Being Rank: 4th
Work Stressors Rank: 35th
Environmental Stressors Rank: 65th
Social Stressors Rank: 37th
Recreation Options Rank: 5th
Photo Credit: Tommy / Adobe Stock / License

Overall Score: 64.64 | Population: ~153,500
Sunnyvale’s rankings by category among midsize cities, 100,000 to 249,000 population:
Mental Well-Being Rank: 1st
Physical Well-Being Rank: 1st
Financial Well-Being Rank: 17th
Work Stressors Rank: 126th
Environmental Stressors Rank: 18th
Social Stressors Rank: 38th
Recreation Options Rank: 73rd
Photo Credit: dragan1956 / Adobe Stock / License
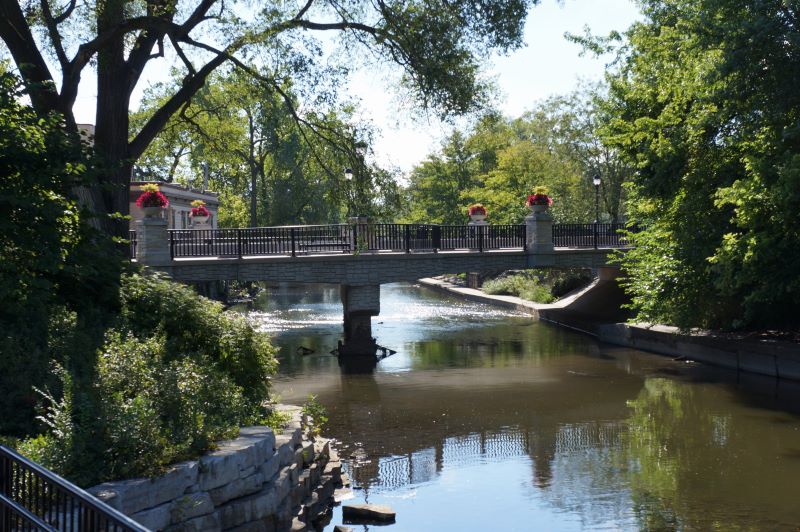
Overall Score: 64.2 | Population: ~149,500
Naperville’s rankings by category among midsize cities, 100,000 to 249,000 population:
Mental Well-Being Rank: 4th
Physical Well-Being Rank: 13th
Financial Well-Being Rank: 2nd
Work Stressors Rank: 224th
Environmental Stressors Rank: 210th
Social Stressors Rank: 4th
Recreation Options Rank: 56th
Photo Credit: David Jakes / Flickr / License

Overall Score: 63.98 | Population: ~100,500
Carmel’s rankings by category among midsize cities, 100,000 to 249,000 population:
Mental Well-Being Rank: 12th
Physical Well-Being Rank: 8th
Financial Well-Being Rank: 2nd
Work Stressors Rank: 93rd
Environmental Stressors Rank: 164th
Social Stressors Rank: 3rd
Recreation Options Rank: 200th
Photo Credit: TheSongbook / Wikimedia Commons / License

Overall Score: 66.03 | Population: ~88,500
Newton’s rankings by category among small cities, under 100,000 population:
Mental Well-Being Rank: 8th
Physical Well-Being Rank: 9th
Financial Well-Being Rank: 1st
Work Stressors Rank: 106th
Environmental Stressors Rank: 84th
Social Stressors Rank: 1st
Recreation Options Rank: 12th
Photo Credit: Kenneth C. Zirkel / Wikimedia Commons / License
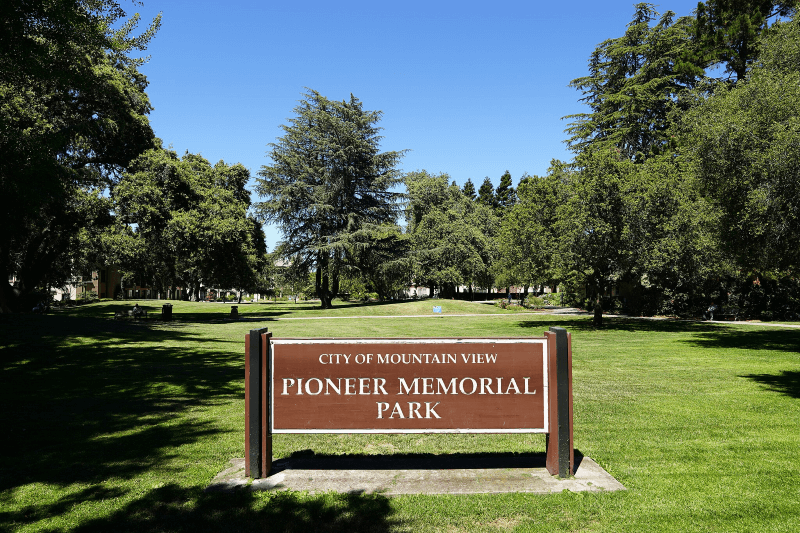
Overall Score: 64.67 | Population: ~82,500
Mountain View’s rankings by category among small cities, under 100,000 population:
Mental Well-Being Rank: 2nd
Physical Well-Being Rank: 3rd
Financial Well-Being Rank: 22nd
Work Stressors Rank: 129th
Environmental Stressors Rank: 13th
Social Stressors Rank: 77th
Recreation Options Rank: 6th
Photo Credit: Steven Baltakatei Sandoval / Wikimedia Commons / License

Overall Score: 63.52 | Population: ~77,000
Woodbury’s rankings by category among small cities, under 100,000 population:
Mental Well-Being Rank: 7th
Physical Well-Being Rank: 14th
Financial Well-Being Rank: 3rd
Work Stressors Rank: 37th
Environmental Stressors Rank: 101st
Social Stressors Rank: 20th
Recreation Options Rank: 83rd
Photo Credit: Jacob / Adobe Stock / License
Key Insights
Higher income helps keep stress in check. Out of the top 10 from each ranking (large, midsize, small), 26 of 30 earn a median income of $106,000 or more, well above the national median of $84,000. Only 4 large cities landed at or below that income mark: Honolulu (No. 7 Large), Lincoln, Nebraska (No. 8 Large), Madison, Wisconsin (No. 9 Large), and Minneapolis (No. 10 Large).
For residents who find joy in the outdoors, several cities stand out:
- Santa Barbara, California (No. 43 Small) leads with the most public gardens per capita.
- Anchorage, Alaska (No. 31 Large), West Palm Beach, Florida (No. 91 Midsize), and Fremont, California (No. 6 Midsize) dedicate more land to parks and recreation than most other cities.
- Colorado Springs (No. 38 Large) and Tucson, Arizona (No. 67 Large) provide extensive trail networks for those seeking to reset in nature.
California cities like Sunnyvale (No. 1 Midsize) and Milpitas (No. 4 Small) are keeping things lighter with some of the lowest depression rates in the country. But the Pacific Northwest is not feeling as sunny, with Spokane, Washington (No. 152 Midsize) and Eugene, Oregon (No. 168 Midsize) landing on the opposite side of the rankings with some of the highest depression rates, a trend often associated with long, cloudy seasons and seasonal affective disorder.
Stressed to the Limit: Flint, Michigan (No. 173 Small), Dayton, Ohio (No. 236 Midsize), and Detroit (No. 91 Large) struggle to find their calm, landing in last place for their corresponding rankings with some of the highest rates of smokers, blood pressure levels, and inadequate sleep among adults.
- Memphis, Tennessee (No. 90 Large) also sinks in the ranking with one of the highest traffic fatality rates, while Cleveland, Ohio (No. 88 Large) follows close behind.
Off the Clock With LawnStarter Pros
How do LawnStarter lawn mowing pros relax after a long day or week of mowing?
“Most days, it’s a hot shower and a giant iced sweet tea,” says Justin Stultz of Wildflower Lawn Care in Hutto, Texas, an Austin suburb.
“I’ve never been a huge reader, but my kids love reading,” he adds. “Recently, I started playing some mellow music and reading some books I’ve been meaning to read after a decade. It’s SUPER relaxing, and now I’m hooked on sci-fi.”
In Virginia Beach, Chelsea Morris, of High-Class Grass, says, “Mowing lawns is relaxing for me. I mean, I’m out in the fresh air, sucking up all the vitamin D the sun can dish out on my skin. … There’s always, and I mean ALWAYS a beautiful flower to stop and smell or cool-looking bugs doing weird bug stuff.
“And, of course, it doesn’t hurt that I live at the beach,” she adds. “There’s nothing like taking a moment when your face is red from busting ass in the heat of the day and your clothes are all sticking to the skin that’s practically melting off of you. …
“I take a little 30-minute side quest and go jump in the ocean. One ride in on a wave will reset your whole mind for the rest of the day and relax your soul.”
In Atlanta, Chuck Vogt of Metro Lawns, says, “Because of our line of work, lawn maintenance doesn’t really tax the brain. For relaxation when I return home, I smoke a cigar and play a game of chess.
“Playing chess activates those neural pathways that otherwise might go dormant,” he adds. “Very relaxing. Especially the cigar!”
Ask the Experts
Relaxation looks different for everyone. We asked a panel of experts to share practical ways to ease tension and stay grounded.
Unwind with their insights below:
- What are three key strategies for feeling less stressed on a daily basis?
- How do you personally decompress after a long day?
- When should a person turn to professional help, like a counselor or therapist, for coping with stress? What initial steps should you take to seek care?
- What are three of the best ways people can help a stressed-out loved one feel better?
- What are three ways that stress can impact health?
- How can stress — mental or financial — impact the economy, if at all?


What are three key strategies for feeling less stressed on a daily basis?
- Connect with something outside of yourself: a person, a pet, a tree, a pigeon. The connection doesn’t have to be elaborate or long to have benefits.
- Put down your smartphone and have a “do nothing” snack — just be where you are.
- Ask yourself, will this matter in 20 years? The answer is usually no. But if it’s yes, then that helps you focus on what’s really important.
How do you personally decompress after a long day?
I play with my puppies or work in the garden.
What are three of the best ways people can help a stressed-out loved one feel better?
- Listen.
- Validate their feelings. Don’t try to talk them out of how they feel.
- Gently help them reframe when they are ready.
What are three ways that stress can impact health?
- Interrupts sleep.
- Elevants cortisol levels which has a range of negative impacts on health.
- Interferes with our ability to connect with others and the world around us. Those connections have enormous benefits.
What are three key strategies for feeling less stressed on a daily basis?
There are two main ways we can cope – we can either change the situation causing us stress (like leaving a bad job or abusive relationship) or sooth the stress we’re feeling by doing things like turning to others for social support.
Sadly, though, most stressful circumstances like economic worries or the state of world events can’t easily be changed. Public policies that provide income security, safe housing, good nutrition, health insurance, and family-friendly workplaces would go a very long way in reducing stress nationwide. However, that is a big wish list that is difficult to achieve.
As a result, most advice for managing stress focuses on the stressed-out person themself.
A few strategies include:
- Turning to others for support, whether emotional, practical, or financial.
- Engaging in healthy practices like exercise, deep breathing, healthy eating, and getting enough sleep so that one is healthy enough to manage the stress.
- Changing our thought processes. Some people have a tendency to catastrophize (let their thoughts spiral out of control, thinking of the worst-case scenario and making themselves more stressed), or ruminate (replaying events over and over in their head, and criticizing themselves for things like “why did I say that?” “why did I do that?”). When we recognize our thoughts spiraling out of control and making us more stressed, we need to take a beat, ask ourselves how realistic those worries really are, and try to develop a rational plan forward.
How do you personally decompress after a long day?
- I love to take long walks to clear out my mind (or do some other form of exercise).
- I have a nice casual dinner at home with my partner, followed by Jeopardy (we love trivia).
- We play with our adorable beagle (pets are a great source of stress relief!).
- Listening to soothing classical music (or playing the piano myself) also helps to decompress.
When should a person turn to professional help, like a counselor or therapist, for coping with stress? What initial steps should they take to seek care?
If someone notices that they are feeling sad or anxious every day, if they have difficulty getting out of bed, and are struggling with basic tasks like grooming or eating three square meals, that’s a sign it’s time for professional help.
Of course, if someone is having suicidal thoughts, thoughts of hurting themselves, or hurting someone else, they absolutely should seek care. But symptoms don’t need to be that severe to seek help.
If someone feels deeply unhappy and seeks a change in their life, professional help can be pivotal. I would suggest first checking with their insurance provider to see which therapists are included in their network. They can also check with friends to see if they have a therapist they like. Some may find community mental health centers helpful, especially if they don’t have insurance.
There’s no shame in seeking care for mental health. We don’t feel embarrassed about going to the doctor when we have a cold, or the dentist when we have a toothache. Mental health care is health care.
What are three of the best ways people can help a stressed-out loved one feel better?
It depends on precisely why the loved one is stressed out. In general, support is key. Support takes different forms.
- First, emotional support involves things like listening and serving as a sounding board. That can help people feel calmer and more loved, and guide them toward making necessary changes to manage the stress.
- Second, instrumental support involves practical forms of help. If work-family overload is stressing out a person, offer to assist with child or elder care, or prepare meals for them. Knowing precisely what kind of help they would find most helpful should be your cue.
- Third, economic support can be critical. Money is one of the leading causes of stress in the U.S., whether debt, inability to pay bills, or concerns about putting enough food on the table. To the extent possible, we can help our friends by providing them food or making a small loan. Importantly, we need to do this delicately and only if our loved one is willing to accept. No one wants to feel patronized or infantilized.
What are three ways that stress can impact health?
Stress has direct physiological effects on the body.
- It can threaten our immune systems making us more vulnerable to colds, infections, and slower healing from wounds.
- Stress also triggers unhealthy behaviors that undermine health. Smokers may find that nicotine soothes their nerves, while others may find solace in high-fat, high-salt comfort foods. Some have a few beers to take the edge off. However, these behaviors — if done too often — lead to a range of diseases including obesity, diabetes, liver disease and more.
- Finally, stress can lead to depression and anxiety. When people are depressed, they may be less vigilant about seeking health care, exercising, going out with friends and other behaviors that can enhance health.
How can stress — mental or financial — impact the economy, if at all?
Stress can impact the economy in several ways.
First, workplace productivity can diminish when people are stressed out. Stress can trigger physical and mental health problems that make people call in sick for work. Those who are at work may not be able to focus and work productively.
The second is that people may have higher health care expenditures. Some people may take medication for stress, while others may find that persistent stress elevates their risk of heart disease. Others still may rely on maladaptive coping behaviors. Behaviors like smoking or drinking might make a stressed-out person feel better in the short term, yet these two behaviors are linked with a range of harmful health outcomes that can increase both one’s health care costs and diminish their workplace productivity.
Note: As I am not a counselor or therapist, I am providing answers based upon my experience and opinions.
What are three key strategies for feeling less stressed on a daily basis?
- Planning in the morning can help prioritize tasks that need to be completed. If possible, complete those tasks you are not enthusiastic about as this can mitigate stress associated with some assignments.
- It is important to set aside protected time for reflection, relaxation, and re-energization. This will help maintain a more holistic work-life balance as sometimes you need to dedicate more time for work and other times you might need more time for life.
- Finally, as we can be overconfident in our abilities, it is important to critically consider what you can do and what you cannot. It is OK to say no. Realizing that you only have so much time and energy, make your contributions on projects that are important.
How do you personally decompress after a long day?
Decompression starts with disconnecting from technology. Setting aside the mobile device and electronics allows me to self-reflect through meditation and release the negative. This process reduces stress and provides a venue for me to recognize accomplishments and to prioritize tasks and projects.
Self-reflection is a holistic process that considers work and personal life. By realizing that work and life are connected and influence each other, I can plan more effectively to mitigate the stress. Sometimes you have to determine what is important and what can be sacrificed. You can’t do everything for everybody.
When should a person turn to professional help, like a counselor or therapist, for coping with stress? What initial steps should they take to seek care?
If you think you need help, seek help. Find a qualified licensed counselor or therapist to help. These individuals have undergone rigorous training to provide specialized services. They have experience in understanding and providing the appropriate assistance.
If this is an issue, consider speaking to a trusted friend, mentor, or religious leader for support. They cannot replace professional help, but they can provide a supportive network until you can get the help.
If it is an emergency, call a crisis line.
What are three of the best ways people can help a stressed-out loved one feel better?
For this question, let’s consider three steps to approach the situation.
- First, offer support. Start a conversation that identifies the behavior or action and how it appears to impact the performance (i.e. especially in a work setting) or routine. Let the person know that this is a safe space to share.
- Step two is to offer to share the burden. This needs to be a genuine effort as deception can be detected. In some cases, the person may decline to share.
- Step three is to be respectful. As a safe space, don’t press or demand answers from the individual. This can create additional stress and it is possible that the individual may lie to avoid sharing. Being supportive means being available when (s)he needs to talk. Being supportive means offering to find appropriate help and take on some of the stressors.
What are three ways that stress can impact health?
Individuals may experience stress differently.
- For some individuals, stress may cause anxiety and difficulty sleeping.
- In others, stress can impact healthy relationships.
- In most everyone, stress has an influence on mental health.
How can stress — mental or financial — impact the economy, if at all?
In general, stress can contribute to individual burnout and individual burnout can lead to other concerns.
In the workplace, burnout contributes to turnover, low productivity, and loss of innovation and creativity. These losses are normally attributed as problems for the employer. However, stress also impacts an individual’s quality of life and often that individual’s finances.
What are three key strategies for feeling less stressed on a daily basis?
It’s easy to get sucked into the stress of our daily lives, and oftentimes we can be so focused on the stressors that we lose sight of the things that bring us joy and happiness.
One strategy is to intentionally tune into and appreciate the little moments each day that bring you joy. These moments can be things like enjoying a cup of coffee, noticing some pretty flowers on your way to work, playing with your pet or child, or receiving positive feedback from others.
Another strategy is to notice the times when your thoughts are racing and you are getting hooked by your thoughts about the things you are stressed about.
When you notice this, you can redirect your attention to your body and/or your five senses to help you tune back into the present moment.
You can achieve this by:
- Taking a few deep breaths.
- Pushing your feet into the floor or your fingertips against each other.
- Having a stretch.
- Noticing, in detail, the sights and the sounds in your environment.
Taking these actions can help to ground you into the present moment and to get you out of your head.
A third strategy is to accept and acknowledge all the emotions that we experience, including the negative ones, rather than trying to push them away. This can sound counter-intuitive, but when we try to suppress or push away our feelings it can be exhausting and they always come back.
Think of it like playing an endless game of tug of war with your emotions; that’s a lot of work! Instead of continuing to tug on the rope, we can drop it. The feelings are still there, but it’s a lot easier if we aren’t struggling with them. It can be helpful to give yourself compassion when you are allowing yourself to feel negative emotions. You can do this by telling yourself, “It’s OK to feel this way,” or by putting a hand over your heart or wherever it feels comforting on your body.
How do you personally decompress after a long day?
I will usually spend some time with my son and my husband and watch a TV show that I enjoy. I typically go to exercise classes a few times a week and I also usually socialize with friends that are in those classes with me.
Physical activity and positive social interaction (even if you are an introvert like me) can be key in reducing stress and promoting mental health. It is also important to engage in activities that are in line with your values and for me, these activities are related to my values concerning parenting, relationships with friends and family, physical health, and leisure.
When should a person turn to professional help, like a counselor or therapist, for coping with stress? What initial steps should they take to seek care?
A person should turn to professional help when they notice that stress or feelings of anxiety or depression are interfering with their everyday functioning (i.e. difficulty focusing and performing well at work, affecting relationships with family, etc.).
It’s also important to seek help if these feelings get in the way of living a life in line with your values or doing the things that are important to you, such as taking care of your health, advancing your career or education, or engaging with your family and friends.
Furthermore, you should seek help if you find yourself relying on substances (including alcohol and marijuana) or other addictive behaviors (i.e. gambling, shopping, video games) as the main way that you cope with stress.
Some easy ways to go about finding a therapist is to check on your insurance company’s website or look at the listings on Psychology Today’s website. You could also use the resource provided by the US Substance Abuse and Mental Health Services Administration (SAMHSA) at findtreatment.gov to find a therapist or program in the community.
What are three of the best ways people can help a stressed-out loved one feel better?
- It is very important as a first step to actively listen to a loved one, without giving advice or suggestions. Sometimes suggestions can be helpful, but often people just want to be heard.
- The next step is to validate their feelings. Examples of validating statements are “I understand, that must be really difficult for you,” or “I would feel angry and hurt too if that happened to me.”
- Lastly, ask your loved one what they need or how you can support them. This can greatly vary from person to person and by situation. For example, one person might just want you to listen, in another case, a loved one may ask for help with household tasks, and in another case, a person may ask for time to do self-care.
What are three ways that stress can impact health?
- There is a great deal of evidence that shows that stress is linked to increased inflammation. This can lead to the development of several health issues including cardiovascular disease, arthritis, and inflammatory bowel diseases.
- Stress can also lead people to engage in unhealthy behaviors that are linked to health problems such as smoking, substance use, alcohol use, unhealthy eating, and lack of physical activity.
- Lastly, stress can interfere with sleep which has a large impact on our physical health. Poor sleep is linked to cardiovascular issues and obesity.
How can stress — mental or financial — impact the economy, if at all?
Stress, especially financial stress, can lead people to make unwise financial decisions because they are often beneficial in the short-term. These decisions tend to keep people stuck in debt and/or poverty, thus impacting the economy.
Not coping well with stress or having a very stressful job where you feel unsupported or not valued by your employer can also affect work productivity and increase turnover, which has a negative impact on businesses.
Methodology
To rank 2026’s Most Relaxed Cities, we compared the 500 biggest U.S. cities across 42 metrics, covering 7 themes.
- Mental Well-Being (14%)
- Physical Well-Being (19%)
- Financial Well-Being (12%)
- Work Stressors (12%)
- Environmental Stressors (14%)
- Social Stressors (6%)
- Recreation Options (23%)
We assigned each metric a weight based on its impact. The categories, metrics, and weights are listed in the table below.
To ensure fair comparisons, we divided the cities into 3 ranking groups — large, midsize, and small — based on the National Center for Education Statistics Locale Classifications and Criteria. Cities were categorized according to population size, allowing similar-sized cities to be evaluated against each other.
Each city earned a score out of 100 for every metric, category, and overall. A city’s Overall Score is the average of its score across all metrics. The city with the highest Overall Score ranked “Most Relaxed” (No. 1) and the lowest “Least Relaxed” in each ranking group: Large Cities (1-91), Midsize Cities (1-236), and Small Cities (1-173).
Notes:
- Large Cities: The “Least Relaxed” among individual factors may not be No. 91 due to ties.
- Midsize Cities: The “Least Relaxed” among individual factors may not be No. 236 due to ties.
- Small Cities: The “Least Relaxed” among individual factors may not be No. 173 due to ties.
- Due to inaccuracies in the Virginia State Police’s sex offender registry, we assigned Virginia an N/A for this metric (Sex Offenders per 100,000 Residents). Our findings will be updated once corrected data is released.
Sources: AllTrails, American Public Gardens Association, CDC, City-Data.com, County Health Rankings & Roadmaps, EPA, Federal Housing Finance Agency, FEMA, IPUMS, National Centers for Environmental Information, Neighborhood Scout, NHTSA, Psychology Today, realtor.com. Trust for Public Land, U.S. Bureau of Labor Statistics, U.S. Census Bureau, Walk Score, WorldData.info, and Yelp
Final Thoughts: Everyday Calm Outdoors
Spending time in nature has been shown to improve sleep, reduce negative thinking, and lower stress.
Gardening brings many of the same rewards. Research highlights that tending to plants can increase self-esteem and ease anxiety while encouraging mindfulness through small, rewarding tasks.
Creating a personal retreat in your own yard doesn’t require much. Start with a few easy upgrades that invite you to step outside more often:
- Install soft grass to feel the stress-relieving benefits of walking barefoot on grass.
- Add color with blooming perennials that return each season.
- Install a gentle water feature like a small pond or bird bath.
- Attract butterflies, birds, hummingbirds, and other wildlife to your backyard.
- Set up a hammock to lounge in or enjoy a backyard picnic.
Even a few minutes outside can shift your mood and slow your pace.
Keep it simple. Step outside, take a breath, and let a local LawnStarter pro handle the rest.
Media Resources
- High-resolution images of cities
- 2024’s Most Relaxed Cities ranking results
- 2023’s Most Relaxed Cities ranking results
- 2021’s Most Relaxed Cities ranking results
Main Photo Credit: Pexels