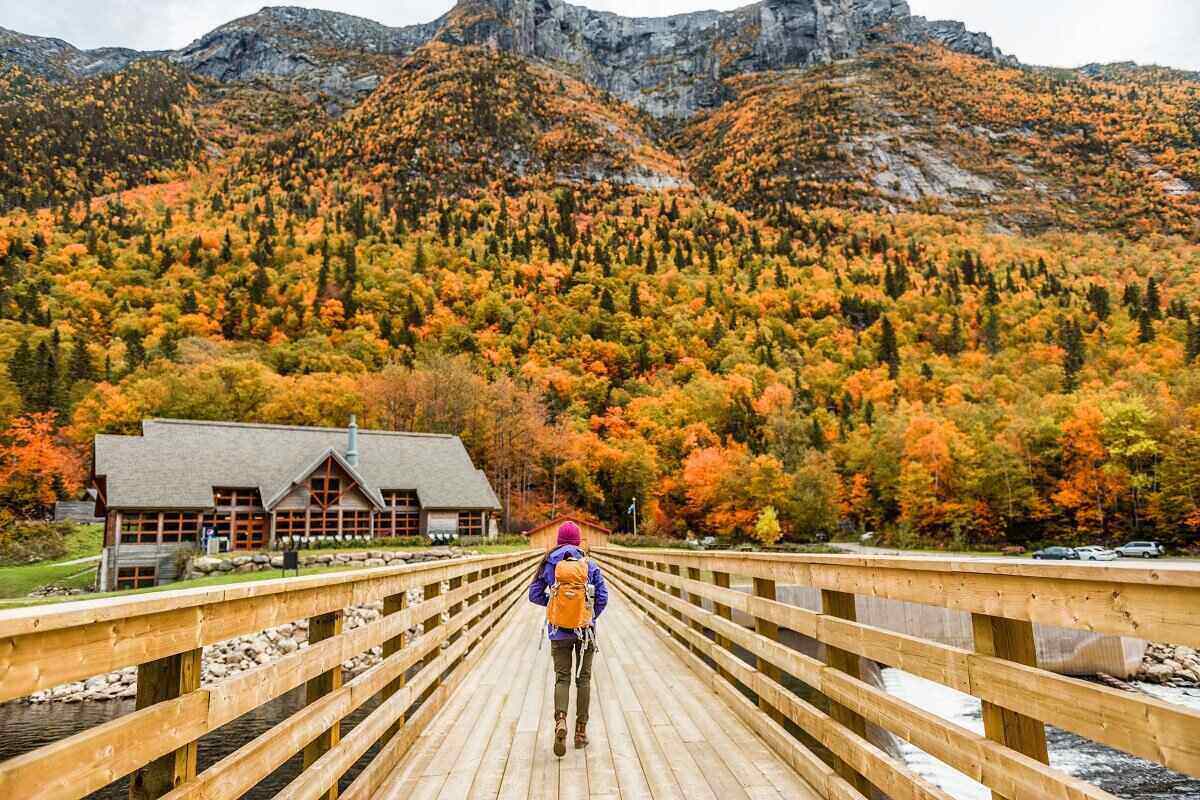
Fall tourism generates billions of dollars in the U.S. annually, but which states offer the best opportunities for seasonal celebrations like picking apples, fall festivals, and leaf-peeping?
With autumn underway, LawnStarter ranked the Best States for Fall Festivities.
We considered the 48 contiguous U.S. states based on 24 total metrics, including duration of fall foliage, forest coverage, and fall festivals. We also considered some traditional fall activities, like apple orchards, corn mazes, and maple farms. Explore our methodology to see the full breakdown of how we ranked the states.
Contents
- Full Ranking: 2025’s Best States for Fall Festivities
- Top 5 States for Fall Fun
- Regional Overview: Top Fall Scenes
- Changing Leaves: Climate and Foliage
- Ask a Local: Fall Destinations
- Methodology
- Growing a Colorful Fall Landscape
2025’s Best States for Fall Festivities
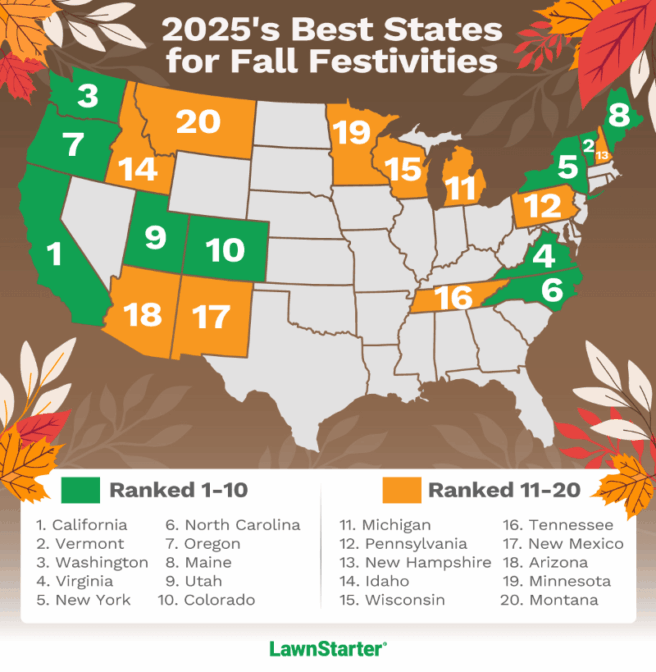
State Rankings
See how each state fared in our ranking:
| Overall Rank (1=Best) | State | Overall Score | Duration of Fall Scenery Rank | Outdoor Recreation Rank | Entertainment Rank | Climate Rank |
|---|---|---|---|---|---|---|
| 1 | California | 60.80 | 1 | 1 | 8 | 45 |
| 2 | Vermont | 54.70 | 29 | 12 | 1 | 9 |
| 3 | Washington | 48.08 | 8 | 2 | 17 | 34 |
| 4 | Virginia | 47.62 | 4 | 8 | 16 | 18 |
| 5 | New York | 47.33 | 10 | 3 | 12 | 31 |
| 6 | North Carolina | 46.59 | 6 | 7 | 9 | 37 |
| 7 | Oregon | 45.86 | 3 | 14 | 11 | 35 |
| 8 | Maine | 45.17 | 24 | 5 | 2 | 19 |
| 9 | Utah | 44.35 | 2 | 17 | 34 | 14 |
| 10 | Colorado | 43.90 | 11 | 10 | 32 | 6 |
| 11 | Michigan | 43.86 | 21 | 13 | 5 | 11 |
| 12 | Pennsylvania | 41.29 | 17 | 9 | 7 | 30 |
| 13 | New Hampshire | 41.00 | 22 | 16 | 6 | 25 |
| 14 | Idaho | 40.14 | 12 | 27 | 23 | 7 |
| 15 | Wisconsin | 38.99 | 27 | 24 | 3 | 16 |
| 16 | Tennessee | 38.85 | 13 | 18 | 30 | 23 |
| 17 | New Mexico | 38.82 | 7 | 33 | 38 | 17 |
| 18 | Arizona | 38.30 | 5 | 19 | 41 | 38 |
| 19 | Minnesota | 38.03 | 20 | 29 | 10 | 13 |
| 20 | Montana | 37.46 | 18 | 31 | 33 | 1 |
| 21 | West Virginia | 37.18 | 16 | 20 | 43 | 5 |
| 22 | Georgia | 36.28 | 15 | 15 | 36 | 26 |
| 23 | Ohio | 35.38 | 34 | 32 | 4 | 20 |
| 24 | Texas | 35.29 | 35 | 11 | 14 | 33 |
| 25 | Massachusetts | 34.87 | 28 | 6 | 24 | 43 |
| 26 | Wyoming | 34.21 | 19 | 38 | 37 | 2 |
| 27 | North Dakota | 33.04 | 31 | 37 | 25 | 3 |
| 28 | South Carolina | 31.31 | 14 | 28 | 40 | 39 |
| 29 | Missouri | 30.46 | 39 | 30 | 19 | 24 |
| 30 | Kentucky | 30.22 | 32 | 34 | 35 | 12 |
| 31 | Arkansas | 30.19 | 25 | 23 | 44 | 29 |
| 32 | Nevada | 30.07 | 9 | 43 | 46 | 28 |
| 33 | Maryland | 29.10 | 23 | 35 | 27 | 42 |
| 34 | New Jersey | 28.94 | 26 | 22 | 28 | 47 |
| 35 | Illinois | 27.82 | 33 | 41 | 22 | 22 |
| 36 | Connecticut | 27.81 | 41 | 26 | 13 | 44 |
| 37 | Indiana | 27.67 | 38 | 42 | 20 | 21 |
| 38 | Alabama | 26.84 | 42 | 21 | 45 | 32 |
| 39 | Nebraska | 26.07 | 30 | 47 | 31 | 8 |
| 40 | South Dakota | 25.55 | 37 | 48 | 29 | 4 |
| 41 | Florida | 25.40 | 48 | 4 | 21 | 48 |
| 42 | Iowa | 25.24 | 40 | 46 | 15 | 15 |
| 43 | Oklahoma | 24.30 | 36 | 40 | 42 | 27 |
| 44 | Rhode Island | 23.65 | 44 | 39 | 18 | 40 |
| 45 | Kansas | 23.43 | 43 | 45 | 26 | 10 |
| 46 | Mississippi | 22.80 | 45 | 25 | 47 | 36 |
| 47 | Louisiana | 15.15 | 47 | 36 | 48 | 41 |
| 48 | Delaware | 14.75 | 46 | 44 | 39 | 46 |
Top 5 States for Fall Fun
Projected Weeks With Fall Foliage: 11 | Rank: 1 (TIE)
Projected Days of Peak Fall Foliage: 68 | Rank: 3
Total Acreage of Forest Land: 31.6 million acres | Rank: 2
Number of Scenic Drives: 123 | Rank: 1
Wineries per 100,000 Residents: 16 | Rank: 3
Best time to visit for colorful fall foliage: Late September to late October in the Northern and Western parts of the state; November in the Southern and Coastal regions.
Local tip: Have a gourd-eous time in Half Moon Bay, the self-proclaimed “pumpkin capital of the world,” which grows over 3,000 tons of pumpkins each year.
Photo Credit: Irene Steeves / Flickr / CC BY-ND 2.0
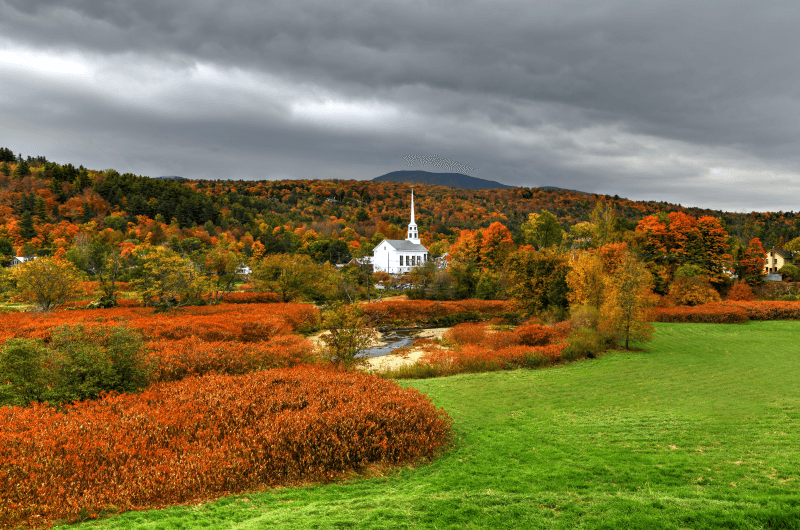
Projected Weeks With Fall Foliage: 7 | Rank: 36
Projected Days of Peak Fall Foliage: 43 | Rank: 20
Portion of State Covered by Forest Land: 76% | Rank: 4
Maple Farms per 100,000 Residents: 223 | Rank: 1
Pumpkin Patches per 100,000 Residents: 11 | Rank: 1
Best time to visit for colorful fall foliage: Late September to mid-October.
Local tip: Visit one of the state’s many sugarhouses for a closer look at how the syrup is made.
Photo Credit: demerzel21 / Adobe Stock / License
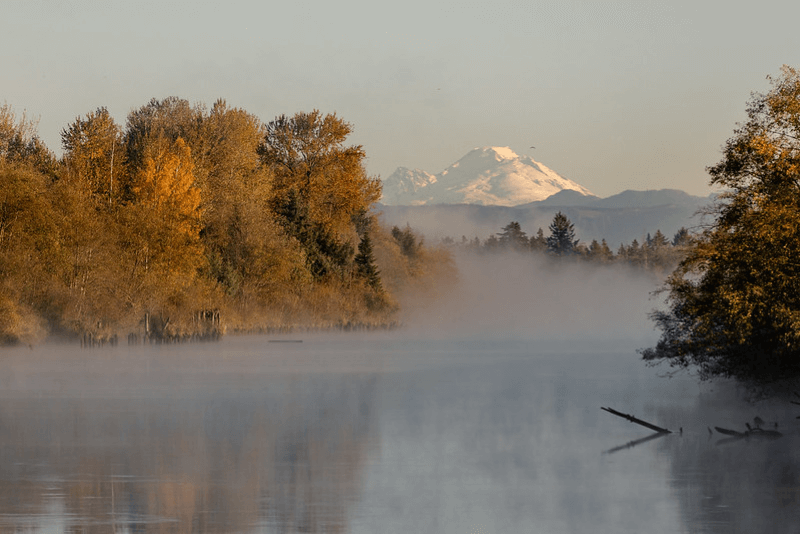
Projected Weeks With Fall Foliage: 10 | Rank: 3
Projected Days of Peak Fall Foliage: 59 | Rank: 10
Total Acreage of Forest Land: 22 million acres | Rank: 9
Number of Scenic Drives: 32 | Rank: 5
Wineries per 100,000 Residents: 18 | Rank: 2
Best time to visit for colorful fall foliage: Late September to early November.
Local tip: Explore Leavenworth, an alpine-themed village with great access to skiing and wineries.
Photo Credit: Cindy Shebley / Flickr / CC BY 2.0
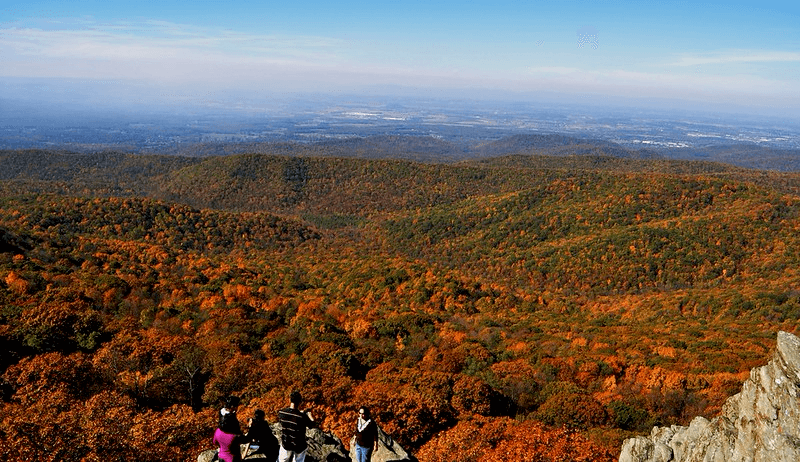
Projected Weeks With Fall Foliage: 11 | Rank: 1 (TIE)
Projected Days of Peak Fall Foliage: 60 | Rank: 9
Portion of State Covered by Forest Land: 63% | Rank: 9
Number of Scenic Drives: 17 | Rank: 9
Wineries per 100,000 Residents: 7 | Rank: 6
Best time to visit for colorful fall foliage: Mid-October to mid-November; Aim for late October if you’re trying to watch foliage around the Blue Ridge Parkway change colors.
Local tip: Take in views of the Blue Ridge Mountains as they turn yellow, orange, red, and brown, along Skyline Drive, running 105 miles through Shenandoah National Park.
Photo Credit: abi.bhattachan / Flickr / CC BY 2.0
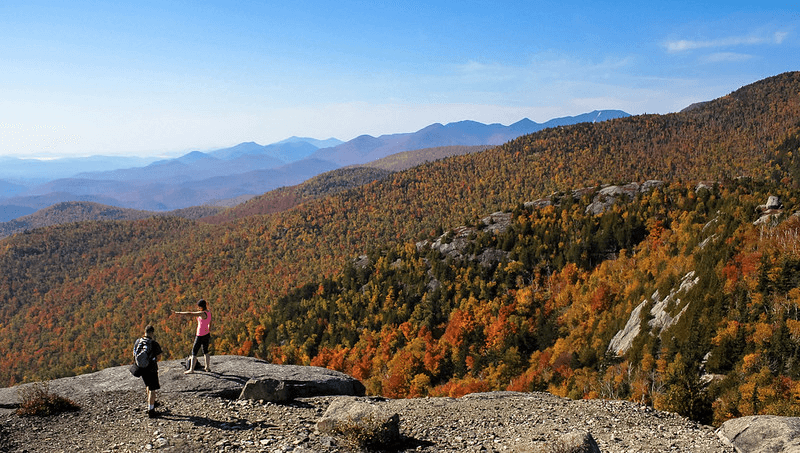
Projected Weeks With Fall Foliage: 9 | Rank: 11
Projected Days of Peak Fall Foliage: 62 | Rank: 8
Portion of State Covered by Forest Land: 62% | Rank: 10
Apple Orchards per 100,000 Residents: 1.4 | Rank: 10
Maple Farms per 100,000 Residents: 7.4 | Rank: 8
Best time to visit for colorful fall foliage: Late September to late October; Aim for the beginning of October if you’re leaf peeping in the Adirondacks or Catskills.
Local tip: Spend your next spooky season exploring the 200+ year-old Legend of Sleepy Hollow and take in over 7,000 carved pumpkins nearby at The Great Jack O’Lantern Blaze.
Photo Credit: iessi / Flickr / CC BY 2.0
Regional Overview: Top Fall Scenes
Every fall, countless tourists flock (with their wallets) from the city to the countryside, or from state to state, to take in the changing leaves.
Read below for more regional insights to guide your autumnal adventures.
New England Nature
The National Park Service reports that New England states generate around $8 billion from fall tourism each year.
- New England gets its colorful reputation from sugar maple trees, with especially high concentrations across Vermont (No. 2). Vermont claims the most maple farms per 100,000 residents, followed by Maine (No. 8) and New Hampshire (No. 13).
- Maine and New Hampshire tie with the lengthiest foliage seasons in New England — 8 weeks — but Massachusetts (No. 25) enjoys the most days with peak foliage in the region, 45 days.
- You might be eager for a Gilmore Girls fall in Connecticut (No. 36), but The Nutmeg State and its neighbor, Rhode Island (No. 44), drop behind in our ranking due to short leaf peeping seasons, few scenic drives, and less forest land to explore.
- All 6 New England states are prepared for festive fall tourism, with top access to apple orchards, pumpkin patches, hayrides, and maple farms, when adjusted per 100,000 residents.
Wandering West
From scenic drives down the Pacific Coast Highway to Guardsman Pass in Utah (No. 9) or Kebler Pass in Colorado (No. 10), Western states offer stunning views, whether from your vehicle or along many mountainous trails.
- California (No. 1), Washington (No. 3), Oregon (No. 7), Utah (No 9), and Colorado (No. 10) have lengthy leaf-peeping seasons, with 10-11 weeks of foliage. Utah boasts the highest number of estimated days of peak fall foliage in our ranking, with 71 days.
- These 5 Western states boast plenty of parks and trails to get up-close views as the seasons change.
- For fall family fun, Utah stands out with the 4th-highest number of corn mazes per 100,000 residents.
Southern Scenes
Outdoor fall adventures abound in Southern Appalachian states like Virginia (No. 4), North Carolina (No. 6), and Tennessee (No. 16).
- Virginia ties with California for the longest projected season of fall foliage — 11 weeks — but North Carolina enjoys 68 days of peak foliage, giving the state about a week longer to enjoy the views than Virginia’s anticipated 60 days.
- All 3 states feature numerous scenic drives — including the iconic Blue Ridge Parkway running through Virginia and North Carolina — with significant portions of each state covered by forests.
- You’ll still want to pack your sweater if visiting these 3 states to leaf peep, where average fall temperatures are around 60 degrees.
Changing Leaves: Climate and Foliage
Changing Leaves: Climate and Foliage
Fall colors might seem a little different year-to-year: Plant and foliage cycles are complex, with climate stresses like temperature, precipitation, and natural disasters impacting the color, timing, and length of fall foliage.
“Climate change leads to greater variation in seasonal weather patterns,” say Dan McCole, associate professor at Michigan State University. “Warm falls can delay peak foliage, and early frosts can shorten the duration of the foliage season.”
“Trees under stress from warmer temperatures may produce less vivid reds, yellows, and orange colors,” he adds. “Over time, tree species known to produce fall colors may struggle to survive in warmer climates as disease and pests migrate.”
- Drought, heat stress, and storm damage can lead to foliage turning brown faster.
- Hot evenings, light pollution, and unseasonably warm Octobers can dull hues or delay foliage. Our warmest states in the fall are Florida (No. 41) and Louisiana (No. 47), which also have the shortest projected foliage season, 5 weeks.
- Early frost can inhibit red-colored foliage.
We noted slight changes in foliage predictions when comparing this year’s data with our 2024 ranking:
- The maximum projected weeks with foliage dropped from 12 weeks in 12 different states in 2024 to 11 weeks in California and Virginia in 2025.
- The maximum projected days with peak foliage dropped from 74 days in 2024 to 71 days in 2025 in Utah.
Shorter foliage seasons may lead to even more overwhelming crowds at the nation’s top leaf-peeping destinations.
“Predicting fall colors has become more difficult with a changing climate; however, there are websites and apps that can help,” McCole says.
- “For instance, the Farmer’s Almanac has maps of the US that predict color changes based on a number of factors, including crowd-sourced reports from readers sharing foliage color changes in their area.”
- “Also, some GPS apps, such as Gaia, offer the ability to view your location via recent satellite images as recently as today or over the past two weeks.”
10 States With the Most Forest Coverage
- Maine (No. 8) — 88%
- New Hampshire (No. 13) — 83%
- West Virginia (No. 21) — 77%
- Vermont (No. 2) — 76%
- Alabama (No. 38) — 71%
- South Carolina (No. 28) — 67%
- Georgia (No. 22) — 66%
- Mississippi (No. 46) — 64%
- Virginia (No. 4) — 63%
- New York (No. 5) — 62%
By comparison. North Dakota (No. 27) is the least likely place for finding forest views, with only 2% of the state covered by forest land.
Ask a Local: Fall Destinations
I am lucky to have celebrated fall in so many different parts of the country.
- In Upstate New York, we’d admire hot air balloons flying over the foliage during the Adirondack Balloon Festival.
- In Charlottesville, Virginia, I’d enjoy apple cider donuts and sunsets at Carter Mountain Orchard.
- Here in Texas, San Antonio is filled with horror fanatics, and spooky season is seemingly celebrated all year long.
I reached out to some folks in other corners of the U.S. to share their favorite fall traditions and best spots for taking in the fall foliage.
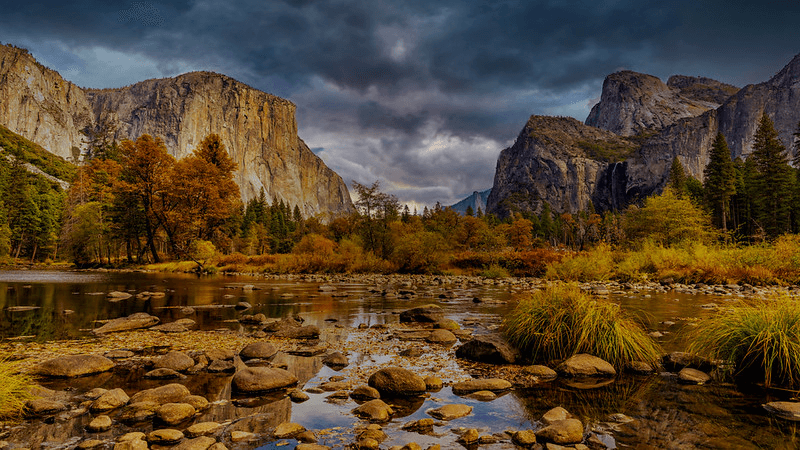
California
“Yosemite National Park is hands down my favorite scenic spot for leaf peeping in California, especially with the Half Dome and El Capitan in the background,” says LawnStarter writer Melanie Joseph. “I’ve only been there once, but it was an unforgettable experience.
“A close second is Lake Tahoe, which was closer to us when we were living up North in Sacramento,” she adds. “That’s where my family and I often go to see the breathtaking fall foliage (November is best).
“And when we moved South to Irvine, I discovered that Big Bear Lake offers a view of autumn colors around a shimmering blue lake that’s almost as magical. It’s like a smaller version of Tahoe.”
Florida
“I live in the West Palm Beach area, so my favorite thing to do in the fall is to visit our nature preserves in hopes of seeing animals such as alligators and our sandhill cranes,” says LawnStarter senior marketing analyst Patricia Davis. “My personal favorites are Okeeheelee Nature Center, the Wellington Environmental Preserve, and Grassy Waters Preserve.
“Other standouts outside of Palm Beach County are, of course, the Everglades National Park, a bit farther south, and Circle B Bar Reserve in Lakeland,” she adds.
“If you want a fall-feeling activity, Bedner’s has a fun pumpkin patch that includes a hay ride, a corn maze, a petting zoo, sunflower picking, and more!”
Massachusetts
This year, Davis took a Halloween trip to Boston and Salem. “We went the last week of October, and while we found it beautiful, a Lyft driver told us that due to the city holding in warmth, the colors will be even more beautiful in a month’s time!” she says.
“My personal favorite thing I did the entire week was exploring Beacon Hill! Explore this area for the cutest shops and photo options. There is a cobblestone road called Acorn Street that is one of the most photographed streets in America.
“Right off Beacon Street is Boston Common, a nearly 50-acre park that is the oldest park in America,” she adds. “Right next to Boston Common is Public Garden, the first botanical garden in America. This was my favorite spot for foliage.”
“No trip to Massachusetts in October is complete without visiting Salem. We knew that when we went on Halloween, it would be crazy busy, so we went two days before as well to ensure we got to really take in the city.”
- “The first day we went, we visited the Salem Witch Museum, but not before stopping at the Salem Witch Trials Memorial to pay our respects. Though the area was beautiful in oranges and reds, it had a very somber feel to it.”
- “On Halloween, we toured a few of the major sites in Disney’s film “Hocus Pocus.” We saw the Old Town Hall of Salem, where the parents in the film partied all night on Halloween. Nearby was the historic Ropes Mansion, known as Allison’s house in the film. We finished up our self-guided tour with a beautiful 30-minute walk down to the water, where we were able to see the most famous house from the film, Max and Dani’s.”
Missouri
When LawnStarter editor-in-chief Jeff Herman lived in St. Louis, “I’d drive up the River Road from Alton to Pere Marquette State Park in Grafton, Illinois; hike or bike the Katy Trail anywhere from St. Charles to Columbia, and, closer to home, just walk around Tower Grove Park seeing the leaf colors and hearing the crunch under your feet.”
New Jersey–New York
For LawnStarter senior managing editor Sharon Sullivan, “Growing up at the northern tip of New Jersey, just a few miles from the New York state line, we used to travel to Warwick, New York, and go to a family-owned apple orchard and get our pumpkins for Halloween and apples. My mom was a huge baker, so we would get bags of apples so she could bring them home and cut them to make apple pies.
“My favorite spot for leaf peeping is where I grew up, at High Point State Park in New Jersey. The trees have amazing leaves and colors, and it’s scenic with the monument and lake. Also, part of the Appalachian Trail runs through the park.”
Texas
Danielle Gorski, another fellow LawnStarter writer, shares her fall traditions: “I live in the Halloween Capital of Texas — Denton. My family and I get into the Halloween spirit by joining in the festivities at the Day of the Dead Festival in Downtown Denton.
“Every year in late October, we dress up in our Day of the Dead costumes and gather with a crowd to watch the coffin races. Businesses or locals can build their own coffin-kart and enter it into the race. My family stands by the railing for hours — if we can get close to the railing; sometimes it is very crowded — watching the wheeled coffins whiz by to see which coffin crosses the finish line first.
“Our other favorite fall tradition is going to the Texas State Fair every year.”
Methodology
To rank the Best States for Fall Festivities, we compared the 48 contiguous U.S. states across 24 metrics.
Our fall metrics covered 4 major themes:
- Duration of Fall Scenery (21%): We counted up the projected number of weeks with fall foliage and the projected number of days with peak foliage, according to the Smoky Mountains Fall Foliage Prediction Map and Explore Fall’s Live Map.
- Outdoor Recreation (36%): We looked at the number of scenic drives, the number and size of state and national parks, total acreage of forest land, and the portion of the state with forest land, access to forest trails, hiking trails, and camping-friendliness.
- Entertainment (30%): We considered the total number of fall festivals, as well as destinations such as apple orchards, corn mazes, pumpkin patches, wineries, cideries, hayrides, and maple farms, per 100,000 residents.
- Climate (13%): We factored in the Natural Hazards index from FEMA, average fall temperatures, precipitation rates, and climate change risk according to the University of Notre Dame.
For each of the 48 contiguous U.S. states, we then gathered data on each factor from the sources listed below the table. Alaska and Hawaii were not included due to a lack of data available.
Finally, we calculated scores (out of 100 points) for each state to determine its rank in each factor, each category, and overall. A state’s Overall Score is the average of its scores across all factors and categories. The highest Overall Score ranked “Best” (No. 1) and the lowest “Worst” (No. 48).
Notes:
- The “Worst” among individual factors may not be No. 48 due to ties.
- Data collection for this ranking occurred from 09/26/25 to 10/21/25.
Sources: Alcohol and Tobacco Tax and Trade Bureau, AllTrails, Cider Scene, Explore Fall, FairsandFestivals.net, Federal Emergency Management Agency, festivalnet, Forest Service, Hayrides.com, HauntWorld.com, Lawn Love, The Maize, MazePlay.com, National Oceanic and Atmospheric Administration, National Park Service, Notre Dame Global Adaptation Initiative,Orange Pippin, PickYourOwn.org, PumpkinPatchesandMore.org, Smoky Mountains, U.S. Census Bureau, U.S. Department of Agriculture, and World Population Review
Growing a Colorful Fall Landscape
There’s no need to go out of your way to find stunning fall scenery if you design your landscape with plants’ seasonal palettes in mind.
- Plant trees with vibrant foliage like maple trees, quaking aspens, oaks, and ginkgos.
- Add reddish hues with colorful shrubs like Brandywine Viburnum, beautyberry, and vines like Virginia creeper.
- Find flowers with fall blooms such as chrysanthemums, asters, and helenium.
- With leaves dropping left and right, embrace the grim aesthetics with a goth garden.
Keep your lawn healthy through the changing seasons with our fall lawn care checklist and help from other autumn lawn care and landscaping guides below.
- 5 Best Ways to Clean Up Leaves in Your Yard
- How to Rake Leaves (Step-by-Step Guide)
- How to Use a Leaf Blower (Step-by-Step Guide)
- How to Winterize Your Lawn
- How to Winterize Your Sprinkler System
- How to Winterize a Garden (in 12 Easy Steps)
Why is LawnStarter ranking the Best States for Fall Festivities?
Fall colors look great, but leaf removal is a lot of work, especially if you rake and bag your leaves. Even wielding a leaf blower can cause shoulder pain. Let our pros get rid of your leaves. Hire a local LawnStarter crew for a fall cleanup.
Media Resources
- High-resolution image of infographic
- High-resolution images of cities
- 2024’s Best States to Visit This Fall ranking results
- 2023’s Best States to Visit This Fall ranking results
- 2022’s Best States to Visit This Fall ranking results
- 2021’s Best States to Visit This Fall ranking results
Main Photo Credit: Shutterstock