
Some people are born rebels, and like everything else these days, there’s data to prove it.
In a time of tightening health restrictions, disobedience — civil or otherwise — has also become practically a national pastime. Displays of defiance at restaurants and mask-less rallies, for example, have spread across the country as COVID lockdowns are reimposed.
But the rule breaking isn’t limited to the pandemic — 2020 has seen an uptick in crime, too. And who could forget the most uncooperative presidential debate in history?
While defiance can be found anywhere and in anyone — even our leaders — not all states break the rules in equal measure.
To find out who’s the most defiant of them all, LawnStarter compared the 50 U.S. states and the District of Columbia across 31 indicators of rule-breaking behavior, from underage drinking to illegal gambling to the prevalence of COVID-19.
Our ranking, surprising findings, and methodology can be found below.
(We’d tell you to scroll down and read, but you’d probably just ignore us anyway.)
Table of Contents
State Rankings
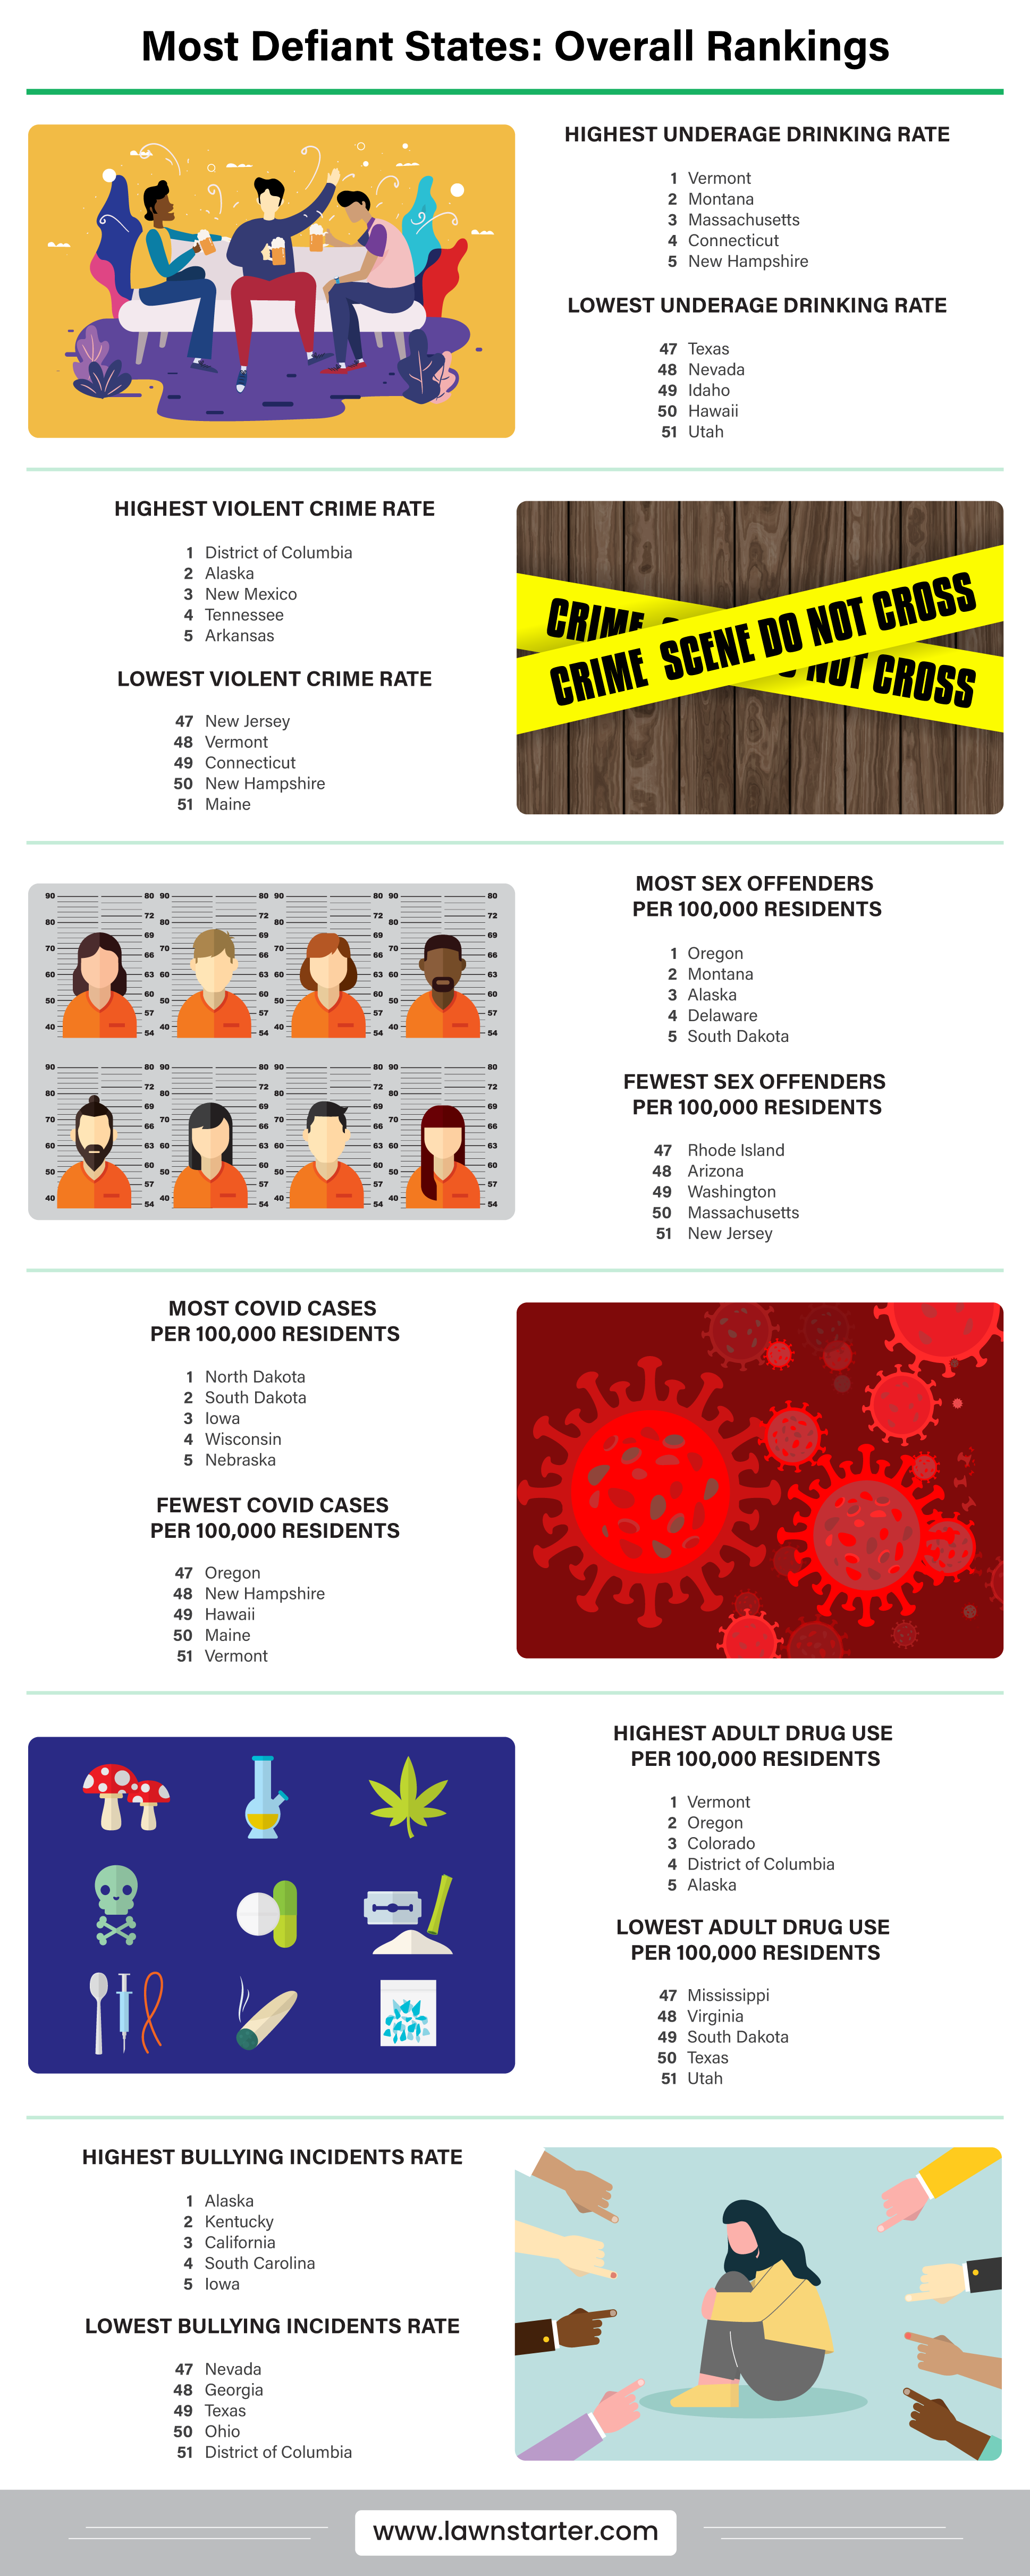
See how each state fared in our ranking:
| OVERALL RANK | State | Total Score | Youth Transgressions Rank | Violent Transgressions Rank | Non-Violent Transgressions Rank |
|---|---|---|---|---|---|
| 1 | Alaska | 49.36 | 1 | 1 | 15 |
| 2 | Montana | 42.41 | 2 | 7 | 16 |
| 3 | New Mexico | 42.36 | 4 | 2 | 28 |
| 4 | Illinois | 38.90 | 19 | 15 | 1 |
| 5 | South Carolina | 38.61 | 24 | 4 | 20 |
| 6 | Louisiana | 38.19 | 10 | 5 | 40 |
| 7 | Wisconsin | 37.99 | 26 | 11 | 3 |
| 8 | Tennessee | 37.43 | 22 | 9 | 10 |
| 9 | District of Columbia | 35.65 | 13 | 3 | 50 |
| 10 | Michigan | 35.61 | 7 | 27 | 17 |
| 11 | Mississippi | 35.36 | 35 | 6 | 11 |
| 12 | South Dakota | 35.35 | 23 | 16 | 6 |
| 13 | Arkansas | 35.04 | 11 | 12 | 31 |
| 14 | North Dakota | 34.95 | 30 | 10 | 8 |
| 15 | New Hampshire | 34.23 | 6 | 39 | 14 |
| 16 | West Virginia | 33.67 | 3 | 29 | 35 |
| 17 | Nevada | 33.61 | 31 | 28 | 4 |
| 18 | Pennsylvania | 33.14 | 38 | 34 | 2 |
| 19 | Arizona | 32.90 | 27 | 17 | 12 |
| 20 | Missouri | 32.78 | 29 | 13 | 21 |
| 21 | Oregon | 31.86 | 32 | 19 | 13 |
| 22 | Kentucky | 31.60 | 18 | 24 | 29 |
| 23 | Alabama | 31.23 | 16 | 8 | 51 |
| 24 | California | 30.92 | 5 | 38 | 41 |
| 25 | Colorado | 30.80 | 34 | 33 | 5 |
| 26 | Maryland | 30.44 | 9 | 37 | 37 |
| 27 | Kansas | 29.86 | 25 | 14 | 45 |
| 28 | Rhode Island | 29.34 | 17 | 51 | 7 |
| 29 | Vermont | 28.77 | 20 | 44 | 22 |
| 30 | Nebraska | 28.71 | 15 | 46 | 27 |
| 31 | Maine | 28.48 | 14 | 48 | 26 |
| 32 | Delaware | 28.20 | 47 | 18 | 19 |
| 33 | Idaho | 27.86 | 8 | 42 | 47 |
| 34 | Iowa | 27.83 | 12 | 45 | 34 |
| 35 | Florida | 27.49 | 36 | 26 | 36 |
| 36 | Texas | 27.28 | 45 | 20 | 25 |
| 37 | Connecticut | 27.26 | 28 | 43 | 18 |
| 38 | Wyoming | 26.49 | 43 | 21 | 38 |
| 39 | North Carolina | 26.48 | 33 | 30 | 43 |
| 40 | Utah | 26.24 | 39 | 35 | 32 |
| 41 | Oklahoma | 26.23 | 37 | 22 | 49 |
| 42 | Indiana | 25.49 | 51 | 23 | 9 |
| 43 | Massachusetts | 24.73 | 21 | 49 | 42 |
| 44 | Ohio | 24.66 | 46 | 32 | 30 |
| 45 | Georgia | 24.63 | 48 | 25 | 39 |
| 46 | New York | 24.49 | 40 | 47 | 23 |
| 47 | Washington | 23.58 | 42 | 40 | 33 |
| 48 | Virginia | 23.24 | 44 | 36 | 46 |
| 49 | New Jersey | 20.74 | 41 | 50 | 44 |
| 50 | Minnesota | 20.16 | 50 | 41 | 24 |
| 51 | Hawaii | 20.03 | 49 | 31 | 48 |
Highlights and Lowlights
The Last Frontier
Alaska sits at the top of our rankings, and for good reason. Often called America’s last wilderness, Alaska is a vast, rugged landscape that draws the independently minded. With high scores across the board — especially in youth transgressions such as chronic school absence and bullying — Alaska is the No. 1 state for going your own way.
Calm Blue States
While the most defiant states are spread across the United States, almost all states at the bottom of our list are reliably blue. Places like Minnesota and New Jersey rank particularly low on violent transgressions such as hate crimes and unintentional shootings. School dropout rates and other youth transgressions are also at the bottom in these compliant states. There’s no definitive answer as to why this is the case, but it could have to do with a sharp economic divide between some red and blue states.
Sin City (and state)
Nevada is a special case when it comes to defiance. While sitting in the middle of our rankings on youth and violent transgressions, it’s in the non-violent categories where the Silver State really shines. Nevada has more prostitution arrests than any other state, more than twice that of the next state (Illinois). Nevada also ranks high on illegal gambling arrests and adult drug users. While not as high on our list as might be expected for the home of Sin City, defiant Nevadans appear to hold their own.
Unassuming Delaware
Sometimes the most rebellious are the ones you least suspect: Delaware ranks surprisingly high in a few key categories. Delaware is far and above the No. 1 state for fraud and embezzlement arrests, possibly due to its unofficial status as a corporate tax haven. Delaware also ranks as the No. 2 state for registered sex offenders. While it may be called “The First State,” Delaware should be one of the last places to choose if you’re a rule-abiding visitor.
Ask The Experts
Defiance often creates change and uncertainty. What will breaking the rules look like in 2021, and where does all this rebellion lead in the future? LawnStarter convened a panel of experts for answers.
- Why is non-compliance with the law more prevalent in some states than in others?
- Certain types of crimes (including homicides, aggravated assaults and gun violence) have spiked, while others (rape, robberies and property crimes) have dropped, during the pandemic. What accounts for the rise and fall in rates of these violations this year?
- What are the short- and long-term effects of increased law breaking on a state’s economic stability?
- How can states best reduce crime and other types of violations, especially during the pandemic?
- What makes people more likely than others to defy COVID-19 rules?
- Are there certain times of the year when rule breaking generally spikes? If so, when and why those times of year?


Why is non-compliance with the law more prevalent in some states than in others?
People and government choice in those states to inadequately provide support to citizens in need of assistance.
Certain types of crimes (including homicides, aggravated assaults and gun violence) have spiked, while others (rape, robberies and property crimes) have dropped, during the pandemic. What accounts for the rise and fall in rates of these violations this year?
The prevalence of guns.
How can states best reduce crime and other types of violations, especially during the pandemic?
We need adequate social support programming.
What makes people more likely than others to defy COVID-19 rules?
Poor information management and poor leadership.
Why is non-compliance with the law more prevalent in some states than in others?
The standard predictors of criminal activity are likely important here (things like structural disadvantage and residential instability). This probably varies to some extent with the laws in question though.
Certain types of crimes (including homicides, aggravated assaults and gun violence) have spiked, while others (rape, robberies and property crimes) have dropped, during the pandemic. What accounts for the rise and fall in rates of these violations this year?
I do not know, and I think it will be some time before we know. I’d caution against taking one year changes as necessarily indicative of any broader trend. We’d want to account for the trends pre-pandemic.
This is something I’m interested in doing, but the way that this methodology works requires more length on the “tail” of the data – meaning, the definitive work on crime will not happen for another two to three years.
Regarding these specific crimes, I suppose one could hypothesize that the pandemic has produced a sense of frustration among people, and that some forms of violence emerge from that.
It would be important to know the context of these violent crimes (what percent happened in the residence, victim-offender relationships, and so forth).
On the other end, other crimes might be on the decline due to a decrease in opportunity. More people at home and fewer people traveling might produce fewer opportunities for property-related crimes.
What are the short- and long-term effects of increased law breaking on a state’s economic stability?
Interesting question. We generally think of this the other way (that economic instability causes crime), but there is some evidence of a feedback relationship.
This seems like a possibility, though an end to the pandemic and the infusion of economic stimulus to halt some of the associated harms of the pandemic could interrupted this feedback loop.
How can states best reduce crime and other types of violations, especially during the pandemic?
There is no one sized fits all approach to reducing crime. It will depend on the types and context of crime that a particular state faces.
However, given the known relationship between economic distress and crime, policies organized to help people may be beneficial in many cases.
What makes people more likely than others to defy COVID-19 rules?
In this case, I suspect that this is about morality and the extent to which people believe in the rules.
Are there certain times of the year when rule breaking generally spikes? If so, when and why those times of year?
In general, crime rates tend to be higher in the summer due to increased contact between people. Other rule-breaking behaviors (like suicide) tend to cluster during stressful months.
Certain types of crimes (including homicides, aggravated assaults and gun violence) have spiked, while others (rape, robberies and property crimes) have dropped, during the pandemic. What accounts for the rise and fall in rates of these violations this year?
Some crimes are up, although I’m hesitant to say that they have “spiked.” For some of these crimes, at least in certain cities, they are up but are still at a level that’s similar to 2016.
Without knowing the context of the homicides, aggravated assaults, and gun violence (e.g., what is the victim/offender relationship), at least some of this increase is likely due to frustration over COVID and the restrictions.
If some of this violence occurs in the home or among family, friends, and acquaintances, then emotions can run high and people can lash out on each other, particularly if they have been confined together.
As to why other crimes, such as rape, robberies, and property crimes have decreased, that is likely due to decreases in opportunity. More businesses are closed or their operations are restricted. More people are working from home.
So, it is more difficult to burglarize a home if people are constantly there. And if the businesses are not open as much, then it’s more difficult to rob the people working there. Muggings decrease because people are more often at home.
What are the short- and long-term effects of increased law breaking on a state’s economic stability?
I’m not aware of the research in this area, so I’m reluctant to guess. At a neighborhood level, increased law breaking can damage the number of businesses operating in an area, however, which in turn reduces employment opportunities in that area.
How can states best reduce crime and other types of violations, especially during the pandemic?
First and foremost, states have to look at the evidence on what works in crime reduction and implement strategies based on that evidence.
Crime reduction strategies vary. If you are talking about crime prevention, then strategies that appear to be the most effective include the following:
- Early intervention programs with at-risk youths.
- Community programs that build social cohesion in a neighborhood.
- Situational programs that reduce opportunity for offending (such as improving lighting, neighborhood watches, etc.).
- Hot-spots policing, problem-oriented policing, and focused deterrence (which focusses on gangs).
- Certain types of rehabilitation programs that focus on high-risk offenders and what led them to commit crimes.
Second, as to increasing compliance with COVID-19 orders, it’s tough to say right now (see my response below).
What makes people more likely than others to defy COVID-19 rules?
There’s some research in this area, although some may not have gone through the peer-review process. Overall, it appears that there is no consistency in reasons to comply or not.
Some research has found that the following may be related to compliance: political orientation (liberals more likely to comply), feeling a moral obligation to obey, fear of the novel coronavirus, social norms (i.e., if others in an area to comply, there can be more “pressure” toward compliance), which media sources are viewed or seen as trustworthy, and income levels (higher income people more able to work from home).
At the same time, other research has found that these factors are not related to compliance.
So, it’s too soon to tell.
Are there certain times of the year when rule breaking generally spikes? If so, when and why those times of year?
Crimes tend to increase during warmer months, such as late spring and summer. The biggest reason for this is opportunity; people are more often away from home, at parties, festivals, etc.
Methodology
We ranked the states and the District in descending order based on their individual score totals. The state that scored the highest ranked No. 1, or “most rule-defiant.”
| Metric | Weighting | Min. Value | Max. Value |
|---|---|---|---|
| School Dropout Rate | 3.23 | 8.60 | 31.50 |
| Chronic Absence Rate in Schools | 3.23 | 9.60 | 27.10 |
| Bullying Incidents Rate | 3.23 | 12.66 | 25.52 |
| Cyber-Bullying Incidents Rate | 3.23 | 10.56 | 20.05 |
| Share of High School Students Who Carried a Weapon at School | 3.23 | 1.33 | 8.54 |
| Share of High School Students Who Have Been in a Physical Fight at School | 3.23 | 5.53 | 14.73 |
| Share of High School Students Who Were Offered, Sold or Given an Illegal Drug at School | 3.23 | 13.43 | 31.48 |
| Share of Children 19-35 Months with All Recommended Vaccines | 3.23 | 65.60 | 82.10 |
| Youth Incarceration Rate | 3.23 | 27 | 302 |
| Underage Drinking Rate | 3.23 | 5.09% | 15.21% |
| Underage Drug Use Rate | 3.23 | 6.02% | 13.92% |
| Youth Transgressions Category Total | 35.48 | ||
| Violent Crime Rate | 3.23 | 115.20 | 1049.00 |
| Property Crime Rate | 3.23 | 1179.80 | 4367.10 |
| Sex Offenders per 100,000 Residents | 3.23 | 50.35 | 749.06 |
| Hate Crimes per 100,000 Residents | 3.23 | 0.18 | 1.51 |
| Law Enforcement Officers Killed and Assaulted per 100,000 Residents | 3.23 | 0.94 | 163.37 |
| Speeding-Related Traffic Fatalities per 100,000 Residents | 3.23 | 1.28 | 8.68 |
| Pedestrian Fatalities per 100,000 Residents | 3.23 | 0.52 | 3.96 |
| Unintentional Gun Shootings per 100,000 Residents | 3.23 | 0.18 | 1.51 |
| Violent Transgressions Category Total | 25.81 | ||
| Drug Overdose Deaths per 100,000 Residents | 3.23 | 4.10 | 42.40 |
| Number of COVID Cases per 100,000 Residents* | 3.23 | 827 | 11334 |
| Adult Drug Use Rate | 3.23 | 7.80% | 20.82% |
| Prostitution-Related Arrests per 100,000 Residents | 3.23 | 100.38 | |
| Illegal Gambling Arrests per 100,000 Residents | 3.23 | 9.02 | |
| Forgery and Counterfeiting Arrests per 100,000 Residents | 3.23 | 0.28 | 31.40 |
| Fraud and Embezzlement Arrests per 100,000 Residents | 3.23 | 0.28 | 151.87 |
| Vandalism Arrests per 100,000 Residents | 3.23 | 6.52 | 218.91 |
| Driving Under the Influence Arrests per 100,000 Residents | 3.23 | 0.99 | 676.54 |
| Disorderly Conduct Arrests per 100,000 Residents | 3.23 | 0.20 | 517.21 |
| Number of Water Quality Violations | 3.23 | 10 | 3433 |
| Number of Air Quality Violations | 3.23 | 1 | 347 |
| Non-Violent Transgressions Category Total | 38.71 | ||
| Overall Total | 100 |
Sources: CDC COVID Data Tracker, Centers for Disease Control and Prevention, Federal Bureau of Investigation, Gun Violence Archive, The Hamilton Project, National Center for Juvenile Justice, SafeHome.org, U.S. Department of Education, U.S. Department of Health and Human Services, U.S. Department of Transportation and U.S. Environmental Protection Agency
Why This Study Matters
America is experiencing a spike in rebellious behavior, from armed resistance in Idaho to protests in Indiana and Utah.
For its entire history, the United States has struggled to balance power and authority between federal, state and local entities. This conflict is exacerbated by the coronavirus, with an increase in defying health authorities and even violent crime. But our rebellious ways began long before the 2020 pandemic.
Since 1776, our country has always carried a fierce independent streak. There’s a clear, obstinate thread connecting the Revolutionary War to all the conflicts surrounding pandemic restrictions and this year’s summer of protest.
But 2020 is nearly behind us. And as we ring in the new year with an eye toward positive change, it’s a good time to reflect on arguably the worst year in recent history.
Main Photo Credit: Shutterstock