Dogs are part of the family, but not all cities make it easy to live like it. Some invest in green space, pet-friendly housing or dining, and local amenities, while others leave dog owners chasing their tails.
“Working with city planners and developers to make spaces dog friendly, for example more grass, waste disposal stations with bags provided, and water stations, is helpful,” says Dr. Steven Marks, dean of Clemson University’s College of Veterinary Medicine.
That kind of thoughtful design makes life easier for pups and people alike. Because we’re thankful for our furry BFFs this month, LawnStarter, ranked 2025’s Best Cities for Dog Lovers, comparing the 500 largest U.S. cities across 37 key factors. We sniffed out everything from yard size and dog-friendly rentals to vet access, affordability, and community support.
Curious if your city leads the pack? Fetch the full ranking below and explore our paw-sone methodology to see how it came together.
Contents
- Top 5 Cities for Dog Lovers
- Leading the Pack: City Rankings
- Key Insights
- Ask the Experts
- Methodology
- Final Thoughts: Where Dog Life Happens
Why is LawnStarter ranking the Best Cities for Dog Lovers?
Because life with dogs happens outdoors. LawnStarter helps homeowners keep lawns safe, clean, and ready for play, the foundation of every dog-friendly home.
Top 5 Cities for Dog Lovers
It’s time to raise the woof. These top five cities earned best-in-show status for dog lovers in 2025.

Animal Shelters per 100,000 Residents: 89.31 | Rank: 1
Number of Dog Shows and Dog Training Events Within 50 Miles: 802 | Rank: 2
Veterinarians per 100,000 Residents: 122.8 | Rank: 3
Average Rating of Dog Parks: 4.83 | Rank: 31
Photo Credit: Grandbrothers / Adobe Stock / License
Average Rating of Dog Parks: 5 | Rank: 1 (tie)
Dog-Friendly Restaurants per 100,000 Residents: 183.32 | Rank: 1
Pet Trainers per 100,000 Residents: 43.45 | Rank: 11
Average Yard Size: 17,908 sq. ft. | Rank: 29
Local tips: “One of our top picks is John Rock Trail in Pisgah National Forest. It’s a beautiful, dog-friendly hike with streams along the way where pups can stop, cool off, and splash around before reaching the stunning rock cliff at the top, says Johanna, Asheville-based creator behind @ladyandthedingo (her dog Brax).
“We also love visiting the North Carolina Arboretum. It’s dog-friendly, peaceful, and full of beautifully maintained gardens and trails. And finally, simply driving the Blue Ridge Parkway is one of our favorite pastimes. Brax loves taking in the sights and smells with the windows down, and there are endless overlooks, picnic areas, and trails where we can stop to explore.”
Photo Credit: Matthew R. / Adobe Stock / License
Dog-Friendly Accommodations per 100,000 Residents: 312.59 | Rank: 6
Average Home Square Footage: 2,543 sq. ft. | Rank: 14
Dog-Friendly Shopping Centers per 100,000 Residents: 7.02 | Rank: 17
Average Ratings of Veterinarians: 4.24 | Rank: 25
Photo Credit: Ray Redstone / Adobe Stock / License

Number of Highly Rated Dog Parks: 19 | Rank: 1
Number of Pet Stores: 432 | Rank: 1
Number of Animal Hospitals: 25 | Rank: 2
Number of Dog Shows and Dog Training Events Within 50 Miles: 711 | Rank: 14
Photo Credit: bildwerfer / Adobe Stock / License

Dog-Friendly Accommodations per 100,000 Residents: 386.52 | Rank: 3
Dog-Friendly Restaurants per 100,000 Residents: 123.55 | Rank: 5
Dog-Friendly Shopping Centers per 100,000 Residents: 13.6 | Rank: 7
Average Yard Size: 24,438 sq. ft. | Rank: 4
Photo Credit: Danita Delimont / Adobe Stock / License
Leading the Pack: City Rankings
Think your city is a dog lover’s dream? Dig into the rankings to see if your city fetches a top spot.
| Overall Rank (1=Best) | City | State | Overall Score | Care Rank | Community Rank | Businesses Rank | Housing Rank | Affordability Rank |
|---|---|---|---|---|---|---|---|---|
| 1 | Frederick | MD | 49.92 | 11 | 2 | 20 | 197 | 59 |
| 2 | Asheville | NC | 48.42 | 13 | 73 | 1 | 55 | 258 |
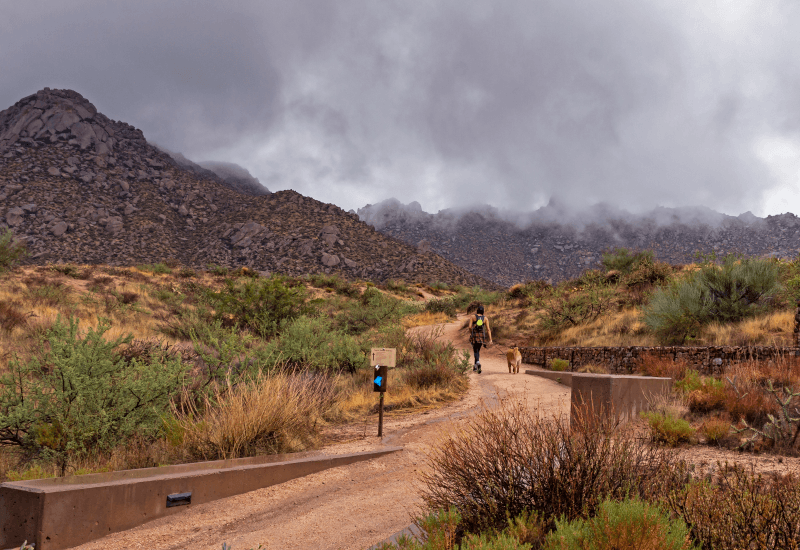
| 3 | Scottsdale | AZ | 46.49 | 22 | 19 | 13 | 11 | 152 |
| 4 | New York | NY | 45.64 | 27 | 1 | 70 | 317 | 137 |
| 5 | Santa Fe | NM | 44.35 | 28 | 95 | 3 | 6 | 430 |
| 6 | Wilmington | NC | 43.18 | 6 | 233 | 19 | 88 | 130 |
| 7 | Orlando | FL | 43.17 | 3 | 196 | 14 | 173 | 352 |
| 8 | Santa Monica | CA | 42.51 | 98 | 3 | 33 | 148 | 48 |
| 9 | Raleigh | NC | 42.01 | 34 | 72 | 61 | 24 | 87 |
| 10 | Bend | OR | 41.85 | 47 | 22 | 8 | 125 | 279 |
| 11 | Knoxville | TN | 41.51 | 1 | 289 | 35 | 93 | 462 |
| 12 | Carmel | IN | 41.07 | 166 | 269 | 7 | 3 | 15 |
| 13 | Tucson | AZ | 41.02 | 5 | 49 | 64 | 167 | 491 |
| 14 | Atlanta | GA | 40.72 | 25 | 257 | 26 | 31 | 81 |
| 15 | Austin | TX | 40.71 | 52 | 33 | 38 | 66 | 138 |
| 16 | Miami | FL | 40.67 | 9 | 119 | 36 | 142 | 443 |
| 17 | West Palm Beach | FL | 40.57 | 2 | 288 | 32 | 207 | 408 |
| 18 | Charleston | SC | 40.49 | 17 | 265 | 17 | 75 | 156 |
| 19 | Flagstaff | AZ | 40.47 | 49 | 63 | 11 | 62 | 422 |
| 20 | Santa Barbara | CA | 40.29 | 67 | 18 | 16 | 266 | 86 |
| 21 | Fort Collins | CO | 40.22 | 12 | 74 | 53 | 296 | 223 |
| 22 | San Diego | CA | 40.07 | 53 | 24 | 54 | 117 | 146 |
| 23 | Roswell | GA | 39.99 | 37 | 339 | 113 | 7 | 13 |
| 24 | Edmond | OK | 39.91 | 24 | 266 | 224 | 25 | 41 |
| 25 | Allen | TX | 39.82 | 205 | 81 | 215 | 2 | 36 |
| 26 | Houston | TX | 39.71 | 40 | 11 | 84 | 260 | 153 |
| 27 | Conroe | TX | 39.62 | 18 | 114 | 274 | 70 | 180 |
| 28 | Richmond | VA | 39.56 | 20 | 65 | 88 | 159 | 204 |
| 29 | Redmond | WA | 39.46 | 203 | 30 | 169 | 23 | 8 |
| 30 | Los Angeles | CA | 39.44 | 58 | 12 | 37 | 240 | 249 |
| 31 | Charlotte | NC | 39.36 | 57 | 102 | 98 | 37 | 109 |
| 32 | Athens | GA | 39.32 | 21 | 331 | 67 | 9 | 306 |
| 33 | Tyler | TX | 39.15 | 65 | 161 | 95 | 12 | 215 |
| 34 | Flower Mound | TX | 39.12 | 183 | 113 | 328 | 5 | 5 |
| 35 | Boca Raton | FL | 39.07 | 16 | 395 | 30 | 76 | 94 |
| 36 | Georgetown | TX | 39.01 | 110 | 88 | 128 | 16 | 120 |
| 37 | Tampa | FL | 38.99 | 35 | 64 | 24 | 233 | 221 |
| 38 | Colorado Springs | CO | 38.86 | 31 | 36 | 109 | 194 | 245 |
| 39 | Las Vegas | NV | 38.81 | 7 | 56 | 96 | 459 | 318 |
| 40 | Franklin | TN | 38.71 | 69 | 349 | 12 | 30 | 89 |
| 41 | Phoenix | AZ | 38.52 | 68 | 7 | 102 | 188 | 413 |
| 42 | Seattle | WA | 38.40 | 91 | 9 | 45 | 356 | 53 |
| 43 | College Station | TX | 38.36 | 14 | 313 | 51 | 131 | 242 |
| 44 | Cary | NC | 38.07 | 200 | 169 | 83 | 19 | 14 |
| 45 | Tacoma | WA | 38.04 | 36 | 25 | 298 | 247 | 222 |
| 46 | Plano | TX | 38.00 | 139 | 124 | 228 | 15 | 60 |
| 47 | Boulder | CO | 38.00 | 126 | 10 | 42 | 274 | 145 |
| 48 | Alexandria | VA | 37.82 | 107 | 17 | 71 | 340 | 16 |
| 49 | Columbia | SC | 37.64 | 8 | 407 | 23 | 246 | 334 |
| 50 | Portland | OR | 37.62 | 118 | 5 | 59 | 325 | 342 |
| 51 | Round Rock | TX | 37.57 | 62 | 203 | 163 | 46 | 73 |
| 52 | Newport Beach | CA | 37.45 | 330 | 41 | 21 | 95 | 11 |
| 53 | Kirkland | WA | 37.30 | 93 | 68 | 183 | 208 | 12 |
| 54 | Gastonia | NC | 37.26 | 51 | 149 | 289 | 36 | 275 |
| 55 | New Braunfels | TX | 37.20 | 132 | 307 | 49 | 4 | 200 |
| 56 | Miami Beach | FL | 37.15 | 64 | 312 | 10 | 141 | 216 |
| 57 | Frisco | TX | 37.13 | 173 | 240 | 237 | 10 | 21 |
| 58 | Sacramento | CA | 37.03 | 123 | 16 | 165 | 172 | 252 |
| 59 | Bellingham | WA | 36.99 | 30 | 52 | 76 | 346 | 344 |
| 60 | Chicago | IL | 36.97 | 87 | 6 | 149 | 341 | 330 |
| 61 | Fort Lauderdale | FL | 36.87 | 23 | 405 | 18 | 121 | 224 |
| 62 | McKinney | TX | 36.83 | 209 | 176 | 222 | 14 | 54 |
| 63 | Bellevue | WA | 36.78 | 196 | 62 | 225 | 111 | 10 |
| 64 | San Antonio | TX | 36.77 | 54 | 46 | 204 | 169 | 386 |
| 65 | Simi Valley | CA | 36.75 | 147 | 47 | 230 | 110 | 84 |
| 66 | Norman | OK | 36.67 | 117 | 98 | 250 | 34 | 201 |
| 67 | Fayetteville | AR | 36.59 | 45 | 325 | 68 | 50 | 192 |
| 68 | Pasadena | CA | 36.59 | 191 | 59 | 80 | 108 | 106 |
| 69 | Baton Rouge | LA | 36.48 | 10 | 382 | 105 | 198 | 363 |
| 70 | Bloomington | IN | 36.46 | 48 | 263 | 6 | 276 | 366 |
| 71 | Fairfield | CA | 36.43 | 208 | 20 | 375 | 114 | 93 |
| 72 | Sugar Land | TX | 36.40 | 77 | 104 | 198 | 245 | 27 |
| 73 | San Francisco | CA | 36.39 | 263 | 4 | 119 | 406 | 32 |
| 74 | Roseville | CA | 36.38 | 261 | 13 | 201 | 122 | 134 |
| 75 | Savannah | GA | 36.32 | 33 | 440 | 5 | 134 | 382 |
| 76 | Vancouver | WA | 36.23 | 32 | 133 | 174 | 221 | 297 |
| 77 | Fort Myers | FL | 36.22 | 4 | 418 | 15 | 455 | 407 |
| 78 | Carlsbad | CA | 36.19 | 220 | 142 | 50 | 85 | 26 |
| 79 | Dallas | TX | 36.12 | 115 | 110 | 92 | 63 | 294 |
| 80 | Mansfield | TX | 36.07 | 236 | 106 | 233 | 18 | 110 |
| 81 | St. Louis | MO | 35.95 | 55 | 103 | 58 | 249 | 332 |
| 82 | Chattanooga | TN | 35.95 | 38 | 311 | 29 | 115 | 376 |
| 83 | Costa Mesa | CA | 35.95 | 179 | 60 | 73 | 186 | 98 |
| 84 | Escondido | CA | 35.90 | 272 | 40 | 327 | 27 | 199 |
| 85 | Naperville | IL | 35.77 | 379 | 28 | 164 | 44 | 39 |
| 85 | Kissimmee | FL | 35.77 | 19 | 343 | 2 | 326 | 492 |
| 87 | Fishers | IN | 35.75 | 95 | 376 | 218 | 33 | 28 |
| 88 | Concord | NC | 35.65 | 89 | 303 | 154 | 53 | 77 |
| 89 | Greensboro | NC | 35.63 | 44 | 197 | 195 | 153 | 257 |
| 90 | Pittsburgh | PA | 35.61 | 72 | 27 | 72 | 403 | 304 |
| 91 | Denver | CO | 35.56 | 92 | 44 | 81 | 334 | 189 |
| 92 | Virginia Beach | VA | 35.37 | 151 | 69 | 138 | 248 | 67 |
| 93 | Tulsa | OK | 35.29 | 41 | 254 | 238 | 137 | 265 |
| 94 | Auburn | AL | 35.28 | 61 | 363 | 257 | 41 | 133 |
| 95 | Cedar Park | TX | 35.21 | 170 | 217 | 192 | 47 | 71 |
| 96 | Gainesville | FL | 35.17 | 15 | 399 | 66 | 120 | 477 |
| 97 | Ann Arbor | MI | 34.95 | 100 | 35 | 77 | 399 | 185 |
| 98 | Stamford | CT | 34.93 | 180 | 193 | 223 | 80 | 47 |
| 99 | Durham | NC | 34.91 | 158 | 234 | 190 | 32 | 155 |
| 100 | Pleasanton | CA | 34.82 | 322 | 34 | 178 | 214 | 4 |
| 101 | Lexington | KY | 34.71 | 80 | 286 | 28 | 219 | 176 |
| 102 | Murfreesboro | TN | 34.68 | 76 | 453 | 199 | 17 | 219 |
| 103 | Mount Pleasant | SC | 34.67 | 56 | 481 | 27 | 39 | 88 |
| 104 | Dayton | OH | 34.66 | 26 | 116 | 89 | 332 | 483 |
| 105 | Folsom | CA | 34.54 | 337 | 127 | 134 | 54 | 25 |
| 106 | Temecula | CA | 34.51 | 257 | 111 | 34 | 210 | 70 |
| 107 | Salt Lake City | UT | 34.47 | 140 | 267 | 9 | 358 | 114 |
| 108 | Indianapolis | IN | 34.43 | 75 | 216 | 91 | 162 | 337 |
| 109 | Pearland | TX | 34.35 | 171 | 308 | 40 | 156 | 29 |
| 110 | Everett | WA | 34.31 | 112 | 53 | 272 | 282 | 273 |
| 111 | Castle Rock | CO | 34.22 | 224 | 218 | 143 | 68 | 76 |
| 112 | Mission Viejo | CA | 34.16 | 125 | 89 | 175 | 375 | 45 |
| 113 | Clearwater | FL | 34.12 | 43 | 247 | 25 | 351 | 391 |
| 114 | Nashville | TN | 34.08 | 103 | 298 | 46 | 127 | 278 |
| 115 | Oceanside | CA | 34.03 | 99 | 230 | 101 | 223 | 167 |
| 116 | Schaumburg | IL | 33.97 | 252 | 138 | 179 | 48 | 235 |
| 117 | Huntington Beach | CA | 33.96 | 237 | 96 | 133 | 215 | 69 |
| 118 | Oklahoma City | OK | 33.90 | 163 | 200 | 189 | 79 | 225 |
| 119 | Arlington | TX | 33.82 | 211 | 162 | 326 | 52 | 238 |
| 120 | League City | TX | 33.79 | 251 | 129 | 373 | 136 | 42 |
| 121 | Suffolk | VA | 33.77 | 441 | 140 | 406 | 8 | 49 |
| 122 | Denton | TX | 33.72 | 168 | 256 | 153 | 83 | 162 |
| 123 | Cincinnati | OH | 33.71 | 94 | 86 | 79 | 328 | 396 |
| 124 | Albuquerque | NM | 33.62 | 88 | 260 | 142 | 107 | 397 |
| 125 | Longview | TX | 33.61 | 70 | 424 | 347 | 26 | 343 |
| 126 | Santa Rosa | CA | 33.59 | 86 | 105 | 226 | 366 | 164 |
| 126 | Columbia | MO | 33.59 | 39 | 255 | 137 | 364 | 211 |
| 128 | Fayetteville | NC | 33.53 | 119 | 135 | 208 | 199 | 321 |
| 129 | Little Rock | AR | 33.48 | 105 | 370 | 69 | 135 | 129 |
| 130 | Anaheim | CA | 33.48 | 331 | 26 | 177 | 206 | 174 |
| 131 | Sandy Springs | GA | 33.47 | 175 | 483 | 320 | 1 | 18 |
| 132 | Wichita Falls | TX | 33.46 | 193 | 158 | 356 | 69 | 296 |
| 133 | Chandler | AZ | 33.43 | 161 | 225 | 180 | 118 | 187 |
| 134 | Fort Worth | TX | 33.43 | 181 | 170 | 275 | 109 | 214 |
| 135 | Mesa | AZ | 33.41 | 149 | 83 | 271 | 171 | 414 |
| 136 | Spokane | WA | 33.40 | 78 | 131 | 100 | 338 | 364 |
| 137 | Grand Rapids | MI | 33.36 | 71 | 179 | 85 | 290 | 419 |
| 138 | Birmingham | AL | 33.33 | 42 | 362 | 57 | 155 | 461 |
| 139 | Louisville | KY | 33.30 | 83 | 231 | 107 | 217 | 346 |
| 140 | Peoria | AZ | 33.28 | 232 | 84 | 318 | 124 | 303 |
| 141 | Gilbert | AZ | 33.28 | 176 | 249 | 244 | 91 | 165 |
| 141 | Melbourne | FL | 33.28 | 50 | 338 | 22 | 281 | 435 |
| 143 | Tallahassee | FL | 33.22 | 66 | 299 | 47 | 222 | 432 |
| 144 | Tustin | CA | 33.19 | 269 | 160 | 213 | 138 | 65 |
| 145 | Lee’s Summit | MO | 33.14 | 250 | 341 | 125 | 61 | 31 |
| 146 | Lafayette | LA | 33.14 | 59 | 358 | 120 | 250 | 182 |
| 147 | Fort Smith | AR | 33.12 | 142 | 340 | 269 | 72 | 126 |
| 148 | Glendale | AZ | 33.07 | 82 | 202 | 260 | 130 | 455 |
| 149 | Vista | CA | 33.06 | 253 | 360 | 217 | 21 | 171 |
| 150 | Tempe | AZ | 33.01 | 124 | 172 | 93 | 183 | 441 |
| 151 | Broomfield | CO | 33.00 | 335 | 125 | 226 | 77 | 111 |
| 152 | Jonesboro | AR | 32.94 | 213 | 369 | 338 | 13 | 285 |
| 153 | Rochester Hills | MI | 32.93 | 281 | 272 | 301 | 28 | 96 |
| 154 | San Marcos | CA | 32.91 | 262 | 183 | 203 | 126 | 105 |
| 155 | Lakeland | FL | 32.87 | 46 | 326 | 86 | 204 | 460 |
| 156 | Murrieta | CA | 32.86 | 130 | 227 | 325 | 272 | 62 |
| 157 | Johns Creek | GA | 32.82 | 259 | 394 | 359 | 22 | 2 |
| 158 | Orange | CA | 32.78 | 311 | 126 | 216 | 176 | 38 |
| 159 | Tracy | CA | 32.74 | 386 | 145 | 362 | 43 | 57 |
| 159 | Norwalk | CT | 32.74 | 216 | 94 | 254 | 318 | 83 |
| 161 | Philadelphia | PA | 32.72 | 146 | 23 | 170 | 441 | 373 |
| 162 | Danbury | CT | 32.63 | 104 | 237 | 343 | 224 | 208 |
| 163 | Minneapolis | MN | 32.63 | 325 | 21 | 118 | 335 | 172 |
| 164 | Lynchburg | VA | 32.51 | 210 | 168 | 112 | 187 | 295 |
| 165 | Thousand Oaks | CA | 32.50 | 341 | 92 | 171 | 146 | 58 |
| 166 | Santa Clarita | CA | 32.44 | 307 | 224 | 173 | 90 | 80 |
| 167 | Irvine | CA | 32.40 | 353 | 112 | 317 | 154 | 44 |
| 168 | Omaha | NE | 32.39 | 111 | 167 | 191 | 342 | 202 |
| 169 | Napa | CA | 32.36 | 377 | 76 | 56 | 262 | 85 |
| 170 | Springfield | MO | 32.32 | 29 | 466 | 74 | 174 | 425 |
| 171 | Albany | NY | 32.32 | 138 | 43 | 106 | 382 | 456 |
| 172 | Syracuse | NY | 32.28 | 227 | 14 | 172 | 347 | 471 |
| 173 | Fullerton | CA | 32.27 | 388 | 48 | 265 | 225 | 66 |
| 174 | Greenville | NC | 32.27 | 63 | 422 | 234 | 82 | 339 |
| 175 | Richardson | TX | 32.22 | 266 | 365 | 194 | 35 | 132 |
| 176 | Redwood City | CA | 32.21 | 274 | 99 | 184 | 369 | 19 |
| 177 | Appleton | WI | 32.21 | 190 | 261 | 41 | 295 | 181 |
| 178 | Goodyear | AZ | 32.20 | 284 | 80 | 286 | 178 | 270 |
| 179 | Kent | WA | 32.13 | 334 | 55 | 394 | 209 | 149 |
| 180 | Chico | CA | 32.12 | 113 | 159 | 168 | 302 | 379 |
| 181 | Lincoln | NE | 32.12 | 188 | 132 | 202 | 289 | 231 |
| 182 | Worcester | MA | 32.10 | 366 | 15 | 129 | 275 | 405 |
| 183 | Reno | NV | 32.07 | 84 | 239 | 229 | 319 | 263 |
| 184 | Livermore | CA | 32.03 | 360 | 42 | 235 | 363 | 23 |
| 185 | El Cajon | CA | 32.02 | 222 | 268 | 231 | 59 | 358 |
| 186 | Chula Vista | CA | 31.95 | 310 | 206 | 436 | 64 | 125 |
| 187 | Roanoke | VA | 31.83 | 128 | 150 | 62 | 385 | 372 |
| 188 | Hillsboro | OR | 31.74 | 230 | 212 | 127 | 213 | 218 |
| 189 | Arvada | CO | 31.72 | 326 | 82 | 232 | 251 | 135 |
| 190 | Amarillo | TX | 31.72 | 85 | 387 | 247 | 166 | 264 |
| 191 | Allentown | PA | 31.69 | 155 | 45 | 241 | 361 | 464 |
| 192 | Warwick | RI | 31.63 | 201 | 165 | 288 | 344 | 104 |
| 193 | Temple | TX | 31.63 | 198 | 242 | 323 | 132 | 348 |
| 194 | Rochester | NY | 31.55 | 79 | 153 | 148 | 339 | 474 |
| 195 | Madison | WI | 31.55 | 60 | 333 | 104 | 384 | 302 |
| 196 | Burbank | CA | 31.54 | 328 | 136 | 122 | 242 | 123 |
| 197 | Winston-Salem | NC | 31.53 | 212 | 310 | 207 | 103 | 290 |
| 198 | Corona | CA | 31.52 | 305 | 39 | 371 | 353 | 136 |
| 199 | Renton | WA | 31.43 | 268 | 182 | 341 | 190 | 154 |
| 200 | Buffalo | NY | 31.41 | 156 | 29 | 209 | 408 | 476 |
| 201 | Irving | TX | 31.40 | 291 | 221 | 376 | 56 | 324 |
| 202 | Mobile | AL | 31.36 | 102 | 425 | 116 | 139 | 333 |
| 203 | Lake Charles | LA | 31.30 | 97 | 456 | 236 | 74 | 280 |
| 204 | Jacksonville | FL | 31.29 | 165 | 238 | 214 | 165 | 434 |
| 205 | Buckeye | AZ | 31.25 | 320 | 66 | 471 | 182 | 311 |
| 206 | Carrollton | TX | 31.24 | 214 | 415 | 401 | 73 | 128 |
| 207 | New Rochelle | NY | 31.22 | 450 | 31 | 416 | 256 | 51 |
| 208 | Lewisville | TX | 31.22 | 280 | 342 | 221 | 60 | 159 |
| 209 | Rock Hill | SC | 31.20 | 122 | 474 | 162 | 29 | 341 |
| 210 | Iowa City | IA | 31.19 | 116 | 252 | 186 | 373 | 203 |
| 211 | Aurora | IL | 31.19 | 272 | 173 | 424 | 147 | 261 |
| 212 | Vacaville | CA | 31.18 | 408 | 50 | 311 | 236 | 122 |
| 213 | San Angelo | TX | 31.16 | 131 | 245 | 330 | 287 | 288 |
| 214 | Long Beach | CA | 31.15 | 238 | 79 | 211 | 379 | 240 |
| 215 | Port St. Lucie | FL | 31.14 | 144 | 280 | 282 | 200 | 378 |
| 216 | Mission | TX | 31.14 | 265 | 188 | 461 | 106 | 239 |
| 217 | San Jose | CA | 31.10 | 225 | 141 | 212 | 432 | 55 |
| 218 | Riverside | CA | 31.06 | 240 | 134 | 321 | 303 | 196 |
| 219 | Torrance | CA | 31.04 | 205 | 139 | 273 | 435 | 72 |
| 220 | Arlington Heights | IL | 31.00 | 349 | 317 | 299 | 67 | 127 |
| 221 | Eugene | OR | 30.99 | 143 | 117 | 97 | 389 | 451 |
| 222 | Kansas City | MO | 30.98 | 108 | 417 | 185 | 185 | 237 |
| 223 | South Fulton | GA | 30.97 | 137 | 500 | 4 | 57 | 212 |
| 224 | High Point | NC | 30.95 | 219 | 175 | 343 | 179 | 418 |
| 225 | Bryan | TX | 30.87 | 233 | 378 | 90 | 87 | 325 |
| 226 | Overland Park | KS | 30.82 | 295 | 383 | 152 | 89 | 74 |
| 227 | Loveland | CO | 30.79 | 202 | 251 | 31 | 371 | 322 |
| 228 | Broken Arrow | OK | 30.78 | 229 | 410 | 309 | 96 | 150 |
| 229 | Midland | TX | 30.78 | 255 | 392 | 303 | 102 | 79 |
| 230 | Corpus Christi | TX | 30.76 | 187 | 195 | 210 | 359 | 232 |
| 231 | Lawton | OK | 30.73 | 184 | 398 | 411 | 45 | 368 |
| 232 | Missoula | MT | 30.73 | 101 | 420 | 140 | 234 | 268 |
| 233 | Huntsville | AL | 30.72 | 278 | 400 | 160 | 84 | 108 |
| 234 | Providence | RI | 30.68 | 243 | 146 | 151 | 372 | 188 |
| 235 | Beaverton | OR | 30.65 | 162 | 305 | 135 | 269 | 322 |
| 236 | Alameda | CA | 30.64 | 400 | 71 | 159 | 402 | 22 |
| 237 | Ventura | CA | 30.61 | 182 | 250 | 78 | 426 | 147 |
| 238 | Waco | TX | 30.60 | 178 | 356 | 147 | 181 | 356 |
| 239 | Fremont | CA | 30.56 | 401 | 101 | 388 | 299 | 20 |
| 239 | South Bend | IN | 30.56 | 74 | 236 | 248 | 381 | 452 |
| 241 | New Orleans | LA | 30.54 | 135 | 348 | 39 | 331 | 361 |
| 242 | Rancho Cordova | CA | 30.53 | 300 | 171 | 329 | 201 | 227 |
| 243 | Glendale | CA | 30.53 | 352 | 120 | 324 | 194 | 241 |
| 244 | Centennial | CO | 30.52 | 399 | 235 | 267 | 71 | 64 |
| 245 | Lakewood | CO | 30.46 | 114 | 327 | 256 | 264 | 309 |
| 246 | Menifee | CA | 30.44 | 409 | 37 | 426 | 314 | 141 |
| 247 | Springfield | IL | 30.41 | 244 | 186 | 150 | 263 | 387 |
| 248 | Surprise | AZ | 30.41 | 177 | 336 | 382 | 140 | 374 |
| 249 | Evanston | IL | 30.39 | 258 | 373 | 206 | 149 | 121 |
| 250 | Las Cruces | NM | 30.38 | 81 | 439 | 131 | 168 | 446 |
| 251 | Boise City | ID | 30.38 | 294 | 189 | 121 | 279 | 210 |
| 252 | Stockton | CA | 30.29 | 373 | 164 | 339 | 113 | 284 |
| 253 | Boston | MA | 30.29 | 276 | 58 | 196 | 485 | 118 |
| 253 | Shreveport | LA | 30.29 | 133 | 447 | 285 | 98 | 326 |
| 255 | Des Moines | IA | 30.26 | 145 | 185 | 287 | 383 | 360 |
| 256 | Elk Grove | CA | 30.19 | 421 | 121 | 384 | 151 | 82 |
| 257 | Redding | CA | 30.18 | 197 | 277 | 145 | 291 | 349 |
| 258 | St. Petersburg | FL | 30.15 | 172 | 294 | 63 | 348 | 357 |
| 259 | Lubbock | TX | 30.12 | 134 | 432 | 176 | 193 | 247 |
| 259 | Reading | PA | 30.12 | 249 | 8 | 279 | 419 | 498 |
| 261 | Springdale | AR | 30.11 | 218 | 445 | 388 | 38 | 179 |
| 262 | Kennewick | WA | 30.09 | 207 | 409 | 239 | 129 | 305 |
| 263 | Clarksville | TN | 30.09 | 96 | 459 | 220 | 144 | 362 |
| 264 | Modesto | CA | 30.04 | 316 | 184 | 363 | 202 | 234 |
| 265 | San Ramon | CA | 30.03 | 390 | 155 | 369 | 273 | 37 |
| 266 | Coral Springs | FL | 30.02 | 226 | 381 | 263 | 100 | 226 |
| 267 | San Mateo | CA | 30.00 | 351 | 77 | 316 | 440 | 46 |
| 268 | Greeley | CO | 30.00 | 150 | 198 | 334 | 377 | 367 |
| 269 | Garland | TX | 29.99 | 247 | 388 | 402 | 105 | 209 |
| 270 | Baltimore | MD | 29.98 | 217 | 107 | 193 | 465 | 250 |
| 271 | Concord | CA | 29.90 | 271 | 122 | 340 | 407 | 160 |
| 272 | Nashua | NH | 29.89 | 239 | 192 | 354 | 417 | 92 |
| 273 | Rancho Cucamonga | CA | 29.85 | 376 | 118 | 261 | 333 | 98 |
| 274 | Scranton | PA | 29.82 | 309 | 93 | 357 | 230 | 447 |
| 275 | Cedar Rapids | IA | 29.81 | 159 | 461 | 307 | 145 | 205 |
| 276 | Elgin | IL | 29.80 | 369 | 271 | 407 | 49 | 375 |
| 277 | Mountain View | CA | 29.79 | 469 | 143 | 99 | 313 | 9 |
| 278 | Spokane Valley | WA | 29.77 | 223 | 322 | 144 | 177 | 429 |
| 279 | Federal Way | WA | 29.75 | 343 | 115 | 400 | 255 | 313 |
| 280 | Hoover | AL | 29.75 | 371 | 469 | 278 | 20 | 33 |
| 281 | Bethlehem | PA | 29.73 | 289 | 246 | 103 | 278 | 283 |
| 282 | Killeen | TX | 29.68 | 264 | 147 | 391 | 322 | 317 |
| 283 | Salem | OR | 29.67 | 204 | 205 | 205 | 316 | 438 |
| 284 | Trenton | NJ | 29.62 | 303 | 38 | 475 | 365 | 427 |
| 285 | Manteca | CA | 29.61 | 412 | 109 | 418 | 243 | 158 |
| 286 | Macon | GA | 29.53 | 241 | 431 | 258 | 40 | 384 |
| 287 | Apple Valley | CA | 29.51 | 370 | 229 | 439 | 81 | 371 |
| 288 | Baytown | TX | 29.50 | 270 | 297 | 331 | 133 | 416 |
| 289 | Upland | CA | 29.49 | 391 | 85 | 276 | 352 | 151 |
| 290 | Citrus Heights | CA | 29.44 | 347 | 148 | 397 | 180 | 402 |
| 291 | Columbus | OH | 29.42 | 260 | 174 | 281 | 301 | 406 |
| 292 | Beaumont | TX | 29.42 | 153 | 384 | 305 | 232 | 350 |
| 293 | Cranston | RI | 29.38 | 306 | 351 | 240 | 218 | 97 |
| 294 | Abilene | TX | 29.38 | 136 | 434 | 249 | 160 | 394 |
| 295 | North Charleston | SC | 29.29 | 235 | 443 | 155 | 112 | 291 |
| 296 | Jersey City | NJ | 29.24 | 363 | 90 | 383 | 448 | 50 |
| 297 | Troy | MI | 29.23 | 304 | 355 | 360 | 143 | 102 |
| 298 | Fort Wayne | IN | 29.19 | 129 | 408 | 161 | 308 | 336 |
| 299 | Davie | FL | 29.17 | 141 | 485 | 270 | 58 | 307 |
| 300 | Lake Forest | CA | 29.17 | 361 | 100 | 187 | 400 | 103 |
| 301 | Bloomington | IL | 29.16 | 184 | 435 | 124 | 268 | 282 |
| 302 | O’Fallon | MO | 29.11 | 199 | 430 | 293 | 205 | 289 |
| 303 | Green Bay | WI | 29.08 | 167 | 364 | 87 | 360 | 338 |
| 304 | Olathe | KS | 29.07 | 443 | 276 | 294 | 164 | 56 |
| 305 | Hesperia | CA | 29.07 | 398 | 214 | 431 | 78 | 403 |
| 306 | Boynton Beach | FL | 29.06 | 73 | 486 | 65 | 189 | 439 |
| 307 | Pasadena | TX | 29.06 | 169 | 372 | 410 | 309 | 244 |
| 308 | Largo | FL | 29.06 | 120 | 330 | 48 | 421 | 459 |
| 309 | Yakima | WA | 28.97 | 231 | 283 | 300 | 261 | 424 |
| 310 | Oxnard | CA | 28.95 | 383 | 91 | 332 | 370 | 194 |
| 311 | St. Paul | MN | 28.94 | 381 | 130 | 315 | 329 | 198 |
| 312 | Chino Hills | CA | 28.91 | 404 | 123 | 252 | 321 | 61 |
| 313 | Deltona | FL | 28.84 | 254 | 248 | 483 | 241 | 417 |
| 314 | Longmont | CO | 28.82 | 290 | 279 | 126 | 307 | 319 |
| 315 | Grand Prairie | TX | 28.77 | 372 | 375 | 433 | 51 | 246 |
| 316 | Akron | OH | 28.77 | 221 | 177 | 312 | 357 | 457 |
| 317 | Erie | PA | 28.75 | 301 | 32 | 111 | 450 | 484 |
| 318 | Lansing | MI | 28.73 | 90 | 274 | 253 | 396 | 486 |
| 319 | Daytona Beach | FL | 28.73 | 121 | 337 | 60 | 390 | 480 |
| 320 | McAllen | TX | 28.70 | 387 | 278 | 349 | 184 | 173 |
| 321 | Duluth | MN | 28.67 | 437 | 292 | 55 | 175 | 268 |
| 322 | Clifton | NJ | 28.67 | 296 | 57 | 441 | 489 | 95 |
| 323 | Evansville | IN | 28.66 | 109 | 467 | 75 | 244 | 444 |
| 324 | Auburn | WA | 28.63 | 297 | 332 | 454 | 191 | 251 |
| 325 | El Paso | TX | 28.62 | 299 | 207 | 351 | 286 | 359 |
| 326 | Peoria | IL | 28.62 | 267 | 285 | 156 | 294 | 400 |
| 327 | Cape Coral | FL | 28.62 | 127 | 423 | 44 | 391 | 412 |
| 328 | Chesapeake | VA | 28.62 | 357 | 243 | 305 | 354 | 78 |
| 329 | Santa Maria | CA | 28.61 | 342 | 51 | 365 | 460 | 331 |
| 330 | Berkeley | CA | 28.55 | 424 | 97 | 157 | 447 | 91 |
| 331 | Yuma | AZ | 28.55 | 164 | 211 | 139 | 458 | 449 |
| 332 | Sunnyvale | CA | 28.55 | 418 | 226 | 266 | 397 | 6 |
| 333 | Oakland | CA | 28.41 | 380 | 150 | 348 | 386 | 119 |
| 334 | Cambridge | MA | 28.40 | 434 | 178 | 132 | 416 | 40 |
| 335 | Aurora | CO | 28.38 | 368 | 210 | 380 | 265 | 271 |
| 336 | Bolingbrook | IL | 28.34 | 417 | 204 | 304 | 211 | 281 |
| 337 | Avondale | AZ | 28.33 | 293 | 273 | 393 | 196 | 445 |
| 338 | Yonkers | NY | 28.31 | 312 | 54 | 453 | 484 | 230 |
| 339 | Warner Robins | GA | 28.28 | 160 | 499 | 346 | 65 | 178 |
| 340 | Lawrence | KS | 28.17 | 292 | 345 | 94 | 306 | 301 |
| 341 | Lancaster | CA | 28.15 | 354 | 128 | 438 | 323 | 398 |
| 342 | Homestead | FL | 28.11 | 106 | 450 | 352 | 170 | 479 |
| 343 | Palm Coast | FL | 28.05 | 308 | 328 | 108 | 277 | 370 |
| 344 | Plymouth | MN | 28.02 | 491 | 190 | 364 | 128 | 17 |
| 345 | Missouri City | TX | 27.99 | 242 | 347 | 366 | 337 | 161 |
| 346 | Woodbury | MN | 27.96 | 481 | 220 | 297 | 116 | 68 |
| 347 | Perris | CA | 27.94 | 414 | 353 | 489 | 94 | 253 |
| 348 | Mesquite | TX | 27.94 | 346 | 344 | 434 | 152 | 315 |
| 349 | Antioch | CA | 27.93 | 406 | 75 | 427 | 446 | 163 |
| 350 | Hollywood | FL | 27.93 | 186 | 454 | 82 | 253 | 421 |
| 351 | Whittier | CA | 27.89 | 384 | 70 | 308 | 468 | 131 |
| 352 | Plantation | FL | 27.89 | 313 | 403 | 200 | 157 | 274 |
| 353 | Davenport | IA | 27.87 | 154 | 457 | 319 | 324 | 184 |
| 354 | Visalia | CA | 27.81 | 286 | 241 | 355 | 401 | 266 |
| 355 | Henderson | NV | 27.76 | 319 | 194 | 353 | 442 | 169 |
| 356 | Rochester | MN | 27.75 | 447 | 199 | 115 | 392 | 90 |
| 357 | Topeka | KS | 27.73 | 302 | 391 | 43 | 231 | 420 |
| 358 | Rio Rancho | NM | 27.69 | 323 | 438 | 396 | 86 | 316 |
| 359 | Palmdale | CA | 27.67 | 374 | 275 | 430 | 237 | 310 |
| 360 | Newton | MA | 27.60 | 475 | 191 | 280 | 336 | 1 |
| 361 | Milpitas | CA | 27.52 | 426 | 282 | 367 | 252 | 75 |
| 362 | Newport News | VA | 27.51 | 317 | 350 | 314 | 312 | 168 |
| 363 | Indio | CA | 27.49 | 359 | 156 | 130 | 454 | 299 |
| 364 | Augusta | GA | 27.49 | 189 | 491 | 242 | 104 | 389 |
| 365 | Columbus | GA | 27.48 | 194 | 480 | 167 | 235 | 206 |
| 366 | Thornton | CO | 27.45 | 315 | 335 | 350 | 320 | 193 |
| 367 | Bloomington | MN | 27.35 | 474 | 144 | 385 | 227 | 175 |
| 368 | Pompano Beach | FL | 27.34 | 195 | 482 | 110 | 150 | 431 |
| 369 | Manchester | NH | 27.33 | 338 | 152 | 259 | 437 | 385 |
| 370 | Rapid City | SD | 27.32 | 248 | 416 | 114 | 315 | 308 |
| 371 | Tuscaloosa | AL | 27.28 | 287 | 497 | 141 | 42 | 327 |
| 372 | Salinas | CA | 27.26 | 345 | 215 | 421 | 410 | 236 |
| 373 | Livonia | MI | 27.26 | 285 | 361 | 398 | 374 | 166 |
| 374 | Southfield | MI | 27.14 | 339 | 448 | 423 | 99 | 355 |
| 375 | Ogden | UT | 27.10 | 321 | 397 | 255 | 259 | 256 |
| 376 | Hemet | CA | 27.09 | 256 | 180 | 379 | 456 | 433 |
| 377 | Washington | DC | 27.05 | 419 | 295 | 52 | 464 | 30 |
| 378 | Billings | MT | 27.01 | 283 | 462 | 136 | 271 | 197 |
| 379 | Medford | OR | 27.00 | 156 | 367 | 166 | 394 | 472 |
| 380 | Clovis | CA | 26.98 | 442 | 305 | 268 | 311 | 115 |
| 381 | Merced | CA | 26.95 | 245 | 291 | 403 | 423 | 390 |
| 382 | Doral | FL | 26.94 | 329 | 390 | 335 | 192 | 300 |
| 383 | Bakersfield | CA | 26.92 | 279 | 314 | 294 | 424 | 292 |
| 384 | Westminster | CO | 26.84 | 423 | 309 | 262 | 283 | 217 |
| 385 | Pawtucket | RI | 26.80 | 340 | 223 | 445 | 433 | 267 |
| 386 | St. George | UT | 26.76 | 395 | 419 | 117 | 304 | 101 |
| 387 | Santa Clara | CA | 26.74 | 462 | 244 | 302 | 422 | 24 |
| 388 | Santa Ana | CA | 26.71 | 394 | 258 | 420 | 310 | 320 |
| 389 | Richmond | CA | 26.69 | 336 | 78 | 468 | 497 | 262 |
| 390 | Farmington Hills | MI | 26.67 | 362 | 426 | 464 | 119 | 229 |
| 391 | Wichita | KS | 26.62 | 324 | 437 | 264 | 238 | 254 |
| 392 | Pueblo | CO | 26.60 | 364 | 321 | 277 | 216 | 463 |
| 393 | Norfolk | VA | 26.59 | 403 | 287 | 219 | 362 | 248 |
| 394 | Anchorage | AK | 26.57 | 174 | 433 | 500 | 367 | 100 |
| 395 | West Covina | CA | 26.56 | 464 | 302 | 409 | 254 | 143 |
| 396 | Quincy | MA | 26.51 | 438 | 166 | 408 | 376 | 272 |
| 397 | Rockford | IL | 26.48 | 355 | 264 | 188 | 300 | 475 |
| 398 | Moreno Valley | CA | 26.47 | 456 | 108 | 469 | 387 | 191 |
| 398 | Sioux Falls | SD | 26.47 | 422 | 379 | 182 | 267 | 186 |
| 400 | Somerville | MA | 26.27 | 461 | 201 | 251 | 476 | 43 |
| 401 | Memphis | TN | 26.22 | 192 | 463 | 197 | 270 | 470 |
| 402 | Kenosha | WI | 26.20 | 367 | 219 | 245 | 451 | 335 |
| 403 | Pasco | WA | 26.07 | 382 | 401 | 440 | 238 | 286 |
| 404 | Hayward | CA | 26.02 | 407 | 281 | 462 | 393 | 170 |
| 405 | Hampton | VA | 26.02 | 452 | 253 | 369 | 349 | 213 |
| 406 | Inglewood | CA | 26.01 | 277 | 316 | 447 | 434 | 399 |
| 407 | Independence | MO | 25.97 | 275 | 484 | 310 | 161 | 381 |
| 408 | Lynn | MA | 25.96 | 476 | 87 | 498 | 327 | 380 |
| 409 | Joliet | IL | 25.84 | 454 | 318 | 414 | 229 | 347 |
| 410 | Vallejo | CA | 25.82 | 392 | 157 | 463 | 453 | 353 |
| 411 | San Leandro | CA | 25.65 | 455 | 137 | 442 | 477 | 157 |
| 412 | Wyoming | MI | 25.61 | 415 | 232 | 449 | 404 | 328 |
| 413 | Buena Park | CA | 25.60 | 479 | 67 | 378 | 475 | 112 |
| 414 | Warren | MI | 25.59 | 246 | 296 | 477 | 482 | 410 |
| 414 | Rialto | CA | 25.59 | 444 | 187 | 482 | 419 | 255 |
| 416 | Palm Bay | FL | 25.54 | 365 | 386 | 335 | 284 | 392 |
| 417 | Sparks | NV | 25.54 | 378 | 406 | 387 | 293 | 259 |
| 418 | Montgomery | AL | 25.51 | 228 | 464 | 290 | 285 | 436 |
| 419 | Fresno | CA | 25.49 | 288 | 352 | 342 | 431 | 395 |
| 420 | Meridian | ID | 25.48 | 453 | 458 | 291 | 158 | 142 |
| 421 | Champaign | IL | 25.35 | 318 | 428 | 123 | 350 | 423 |
| 422 | North Port | FL | 25.32 | 234 | 470 | 322 | 345 | 345 |
| 423 | Odessa | TX | 25.25 | 332 | 449 | 337 | 305 | 287 |
| 424 | Edinburg | TX | 25.24 | 436 | 477 | 458 | 101 | 190 |
| 425 | Sioux City | IA | 25.22 | 282 | 427 | 374 | 425 | 260 |
| 426 | Racine | WI | 25.19 | 389 | 209 | 246 | 388 | 485 |
| 427 | Downey | CA | 25.09 | 429 | 270 | 404 | 461 | 183 |
| 428 | Pembroke Pines | FL | 25.04 | 397 | 478 | 292 | 92 | 365 |
| 429 | Waukegan | IL | 24.95 | 428 | 259 | 451 | 378 | 404 |
| 430 | Sterling Heights | MI | 24.89 | 348 | 315 | 481 | 443 | 368 |
| 431 | Ontario | CA | 24.85 | 405 | 213 | 415 | 457 | 277 |
| 432 | Hialeah | FL | 24.84 | 298 | 393 | 479 | 257 | 488 |
| 433 | Nampa | ID | 24.84 | 435 | 442 | 283 | 258 | 243 |
| 434 | Milwaukee | WI | 24.82 | 350 | 222 | 243 | 480 | 465 |
| 434 | Flint | MI | 24.82 | 152 | 290 | 413 | 466 | 500 |
| 436 | Victorville | CA | 24.80 | 410 | 368 | 419 | 355 | 312 |
| 437 | Bismarck | ND | 24.78 | 473 | 465 | 333 | 97 | 117 |
| 438 | Pomona | CA | 24.77 | 356 | 301 | 478 | 474 | 298 |
| 439 | Fontana | CA | 24.62 | 459 | 293 | 473 | 412 | 195 |
| 440 | Toledo | OH | 24.56 | 440 | 181 | 345 | 368 | 489 |
| 441 | Chino | CA | 24.49 | 451 | 366 | 358 | 428 | 124 |
| 442 | South Gate | CA | 24.39 | 488 | 61 | 486 | 415 | 442 |
| 443 | Sunrise | FL | 24.22 | 333 | 452 | 443 | 220 | 467 |
| 444 | Lakewood | CA | 23.90 | 470 | 208 | 405 | 486 | 116 |
| 445 | New Bedford | MA | 23.85 | 411 | 154 | 465 | 491 | 454 |
| 446 | New Haven | CT | 23.78 | 375 | 346 | 284 | 470 | 409 |
| 447 | Brooklyn Park | MN | 23.67 | 492 | 163 | 480 | 398 | 233 |
| 448 | Elizabeth | NJ | 23.55 | 433 | 320 | 492 | 430 | 401 |
| 449 | Jackson | MS | 23.49 | 148 | 490 | 377 | 288 | 497 |
| 450 | Layton | UT | 23.46 | 484 | 494 | 381 | 123 | 35 |
| 451 | Westland | MI | 23.40 | 393 | 389 | 452 | 395 | 437 |
| 452 | Gresham | OR | 23.39 | 413 | 436 | 435 | 297 | 448 |
| 453 | Westminster | CA | 23.31 | 430 | 385 | 417 | 445 | 276 |
| 454 | Pittsburg | CA | 23.29 | 485 | 324 | 456 | 413 | 144 |
| 455 | Cleveland | OH | 23.22 | 327 | 334 | 181 | 473 | 493 |
| 456 | Fargo | ND | 23.09 | 446 | 472 | 146 | 405 | 140 |
| 457 | Daly City | CA | 22.91 | 463 | 284 | 437 | 499 | 63 |
| 458 | Miramar | FL | 22.86 | 460 | 460 | 432 | 212 | 388 |
| 459 | Bridgeport | CT | 22.80 | 358 | 304 | 459 | 493 | 453 |
| 460 | Detroit | MI | 22.80 | 314 | 262 | 361 | 483 | 499 |
| 461 | Portsmouth | VA | 22.74 | 471 | 300 | 425 | 438 | 340 |
| 462 | Deerfield Beach | FL | 22.68 | 344 | 421 | 158 | 427 | 494 |
| 463 | South Jordan | UT | 22.62 | 489 | 496 | 450 | 203 | 7 |
| 464 | Alhambra | CA | 22.49 | 439 | 412 | 386 | 467 | 293 |
| 465 | Lawrence | MA | 22.35 | 466 | 413 | 493 | 298 | 458 |
| 466 | Bellflower | CA | 22.17 | 467 | 414 | 488 | 409 | 351 |
| 467 | Pharr | TX | 22.12 | 449 | 488 | 412 | 228 | 354 |
| 468 | San Bernardino | CA | 22.11 | 432 | 371 | 460 | 463 | 440 |
| 469 | Brockton | MA | 22.10 | 448 | 444 | 494 | 449 | 207 |
| 470 | Garden Grove | CA | 21.94 | 458 | 395 | 466 | 472 | 314 |
| 471 | Jurupa Valley | CA | 21.89 | 487 | 374 | 496 | 380 | 177 |
| 472 | El Monte | CA | 21.82 | 483 | 228 | 490 | 481 | 426 |
| 473 | West Jordan | UT | 21.81 | 499 | 455 | 456 | 292 | 52 |
| 474 | Sandy | UT | 21.79 | 494 | 471 | 313 | 280 | 34 |
| 475 | Springfield | MA | 21.72 | 385 | 322 | 390 | 495 | 473 |
| 476 | Newark | NJ | 21.69 | 427 | 329 | 467 | 429 | 495 |
| 477 | Lowell | MA | 21.60 | 420 | 446 | 372 | 462 | 411 |
| 478 | Paterson | NJ | 21.31 | 396 | 380 | 497 | 487 | 466 |
| 479 | Parma | OH | 21.22 | 496 | 402 | 392 | 330 | 329 |
| 480 | Honolulu | HI | 21.13 | 457 | 441 | 499 | 471 | 139 |
| 481 | Dearborn | MI | 21.07 | 416 | 451 | 448 | 479 | 428 |
| 482 | Provo | UT | 20.87 | 482 | 468 | 296 | 418 | 220 |
| 483 | Hartford | CT | 20.74 | 402 | 357 | 429 | 478 | 496 |
| 484 | Carson | CA | 20.59 | 497 | 411 | 472 | 444 | 148 |
| 485 | Lehi | UT | 20.56 | 498 | 495 | 399 | 343 | 3 |
| 486 | Norwalk | CA | 20.52 | 490 | 404 | 484 | 469 | 228 |
| 487 | Fall River | MA | 20.45 | 445 | 359 | 485 | 490 | 482 |
| 488 | Hammond | IN | 20.38 | 215 | 479 | 422 | 500 | 450 |
| 489 | Hawthorne | CA | 20.33 | 477 | 377 | 446 | 488 | 415 |
| 490 | North Las Vegas | NV | 20.20 | 465 | 475 | 476 | 414 | 377 |
| 490 | Miami Gardens | FL | 20.20 | 472 | 493 | 487 | 163 | 481 |
| 492 | Orem | UT | 20.04 | 478 | 489 | 395 | 452 | 107 |
| 493 | Brownsville | TX | 20.03 | 425 | 476 | 427 | 439 | 469 |
| 494 | Compton | CA | 19.77 | 480 | 353 | 491 | 496 | 383 |
| 495 | Kansas City | KS | 19.47 | 486 | 487 | 368 | 226 | 478 |
| 496 | Laredo | TX | 19.04 | 431 | 473 | 470 | 494 | 393 |
| 497 | Waterbury | CT | 17.62 | 493 | 429 | 444 | 492 | 468 |
| 498 | Lauderhill | FL | 17.53 | 468 | 492 | 474 | 436 | 487 |
| 499 | West Valley City | UT | 17.31 | 500 | 498 | 455 | 411 | 113 |
| 500 | Cicero | IL | 17.17 | 495 | 319 | 495 | 498 | 490 |
Key Insights
Best in Show: 28 Southern cities landed in the top 50 for dog lovers, alongside small and midsize standouts like Frederick, Maryland (No. 1) and Asheville, North Carolina (No. 2). These cities shine with top-rated vets, plenty of dog sitters, and active Meetup scenes, along with strong dog-friendly dining and shopping options.
Fetch Friendly Yards: Yard space rules in Santa Fe, New Mexico (No. 5), Athens, Georgia (No. 32), and Flower Mound, Texas (No. 34), where big backyards give pups room to roam. “Some dogs do best with a fenced-in yard and space to run,” says Dr. Susan Nelson clinical professor at Kansas State University.
The Big-City Advantage: City life suits dogs just fine in major metros like New York (No. 4), Austin (No. 15), Los Angeles (No. 30), and Charlotte (No. 31). These big cities trade yard space for walkable streets, plentiful parks, and strong access to pet amenities and emergency care. City walks double as social time, too. “frequent walks and new environments help dogs socialize and adapt to city life,” Marks adds.
Paw & Order: 3 states earn top marks when it comes to regulating commercial breeders: New York, Illinois, and Oregon. Each enforces strict rules for licensing, while New York’s Puppy Mill Pipeline Law bans the retail sale of dogs in pet stores and promotes shelter adoption.
The Price of Puppy Love: Pet care costs can take a bite out of income in Detroit, Michigan (No. 460), Newark, New Jersey (No. 476), and Hartford, Connecticut (No. 483). “Owning a dog can be expensive, and the larger the breed, the more it costs to feed it and pay for food, medication, and veterinary bills,” Nelson says.
Fetch the Facts
Fetch the Facts 🐕
Ask the Experts
Dogs are part of everyday life in cities across the globe. Some places make it easy for pups and their people to thrive with access to parks, pet services, and welcoming spaces, while others are still catching up on dog-friendly design and community support.
We asked a panel of experts how cities can work together to create spaces where dogs truly belong. Dig through their insights below:
- What can dog owners do to make sure their pups are socialized before unleashing them around other hounds at dog parks and dog-friendly events?
- Besides lots of dog parks and vets, how can local governments make their cities more attractive to dog owners?
- What are the three most important considerations when adopting a dog?
- Many animal shelters are struggling with increasing pet surrenders as a result of higher housing costs. How can dog owners help their local Humane Society if they can’t bring home any more pups?


What can dog owners do to make sure their pups are socialized before unleashing them around other hounds at dog parks and dog-friendly events?
It is best to start socializing your dog when it is a puppy, as that is when they are most responsive to learning new things. Puppy kindergarten classes are a great way to get off on the right foot.
It is also important to ensure they get to play with other dogs as a puppy as well so they learn their social cues. Make sure the other dogs they play with are known to be trusted to play well with puppies and are up-to-date on their vaccinations.
Have an older puppy or adult dog? Keep it on a leash when first meeting new dogs to see how it responds.
- If it is scared or aggressive in response to the encounters, it is best to keep it out of the dog park and other events where there will be other dogs.
- Does it respond by play bowing and have a relaxed expression? Then being around other dogs is likely possible.
Besides lots of dog parks and vets, how can local governments make their cities more attractive to dog owners?
- Leash laws are actually good for everyone, including dog owners.
- Dog-friendly restaurants and hotels are also attractive to dog owners.
- Having dog-specific events, such as an end-of-the-summer pool party at a local pool is fun for owners and dogs alike.
What are the three most important considerations when adopting a dog?
There are many things to think about prior to adopting a dog, but listed below are three important ones.
- Does your lifestyle suit having a dog? Dogs need to be walked and have time each day to spend with you, as they are very social animals. Some dogs need a lot of exercise as well. Other dogs need to be groomed on a regular basis. Are you able to do it or are you able to afford to take it to a groomer?
- Does your current living situation suit the needs of the dog you want to get? Some dogs do best if they have a fenced-in yard in which to run around. Owning a Great Dane or Border Collie may not be the best idea if you live in a small apartment and can’t get out to exercise it on a regular basis.
- Can you afford to own a dog? Let’s face it, owning a dog can be expensive, and the larger the breed, the more it costs to feed it and pay for food, medication, and veterinary bills. Maybe you can afford general care, but can you afford emergency expenses that can occur? If not, can you afford pet insurance? Can you afford a pet sitter or a boarding facility if needed?
Many animal shelters are struggling with increasing pet surrenders as a result of higher housing costs. How can dog owners help their local Humane Society if they can’t bring home any more pups?
There are several ways to help your local animal shelter or humane society. You can:
- Donate pet food.
- Donate old towels and blankets for bedding.
- Volunteer your time to walk and socialize dogs.
- Donate money to go towards shelter and/or humane society expenses.
- Have a fundraiser.
- Transport animals (if needed) to other shelters that aren’t as crowded.
What can dog owners do to make sure their pups are socialized before unleashing them around other hounds at dog parks and dog-friendly events?
The best way to socialize dogs is to introduce them slowly to other dogs. Socialization is best done when dogs are young, but can still be accomplished as adults. This may take some time so pet owners may need to be patient.
A good way to socialize dogs is during frequent walks where they can be introduced to new environments, people, and dogs. Dog parks should be the culmination of a slow process of introducing your dog to others.
It is also important for owners to understand their dogs and notice their body language to avoid confrontations.
Besides lots of dog parks and vets, how can local governments make their cities more attractive to dog owners?
Cities can be made more dog-friendly by:
- Educating the pet-owning and non-pet-owning communities.
- Working with city planners and developers to make spaces dog-friendly — e.g. more grass, waste disposal stations with bags provided, water stations, etc.
- Encouraging buildings, restaurants, and shopping areas to be dog-friendly.
- Discouraging HOA and rental agreements that ban dogs.
- Educating in the benefit of dog ownership and the human-animal bond.
- Encourage dog facilitative therapy to the public e.g. in hospitals and schools.
What are the three most important considerations when adopting a dog?
- Make sure your family is prepared for responsible pet ownership.
- Financial and emotional factors.
- Make sure you investigate dog breeds online or in the library to understand the size, environment required, activity level, if they’re good with children, etc.
Many animal shelters are struggling with increasing pet surrenders as a result of higher housing costs. How can dog owners help their local Humane Society if they can’t bring home any more pups?
The best way to help animal shelters is to meet with them and brainstorm ideas for exposure to the public for further adoptive families. This could include adoption days at businesses and public events. Education and pet population control is a longer-term goal and everyone can play a role in education.
What can dog owners do to make sure their pups are socialized before unleashing them around other hounds at dog parks and dog-friendly events?
- Be sure they are vaccinated and healthy.
- Test them out around familiar and friendly dogs. Take gradual steps with increasing people and/or dog populations. For example, if a dog has never really interacted with more than 2 or 3 dogs at a time, don’t jump into an event with 50+ dogs and expect him to be fine.
- Walk the perimeter and gauge their response before entering a highly populated area.
Besides lots of dog parks and vets, how can local governments make their cities more attractive to dog owners?
- Improve their walkability scores.
- Encourage government and/or organization-sanctioned dog events.
- Increase the number of dog poop stations and water stations.
What are the three most important considerations when adopting a dog?
Providing for their needs:
- Space.
- Time.
- Financial commitment.
Knowing that wherever life takes you in the future, you are going to prioritize having your dog with you.
Many animal shelters are struggling with increasing pet surrenders as a result of higher housing costs. How can dog owners help their local Humane Society if they can’t bring home any more pups?
Donate, volunteer, and spread the word about adoptable dogs that need homes.
What can dog owners do to make sure their pups are socialized before unleashing them around other dogs at dog parks and dog-friendly events?
Remember that only a minority of dogs actually enjoy situations like this, and it is completely normal if your dog would prefer to just hang out with a few known dog friends or even just relax with their human family in a more low-key environment. That said, if you have a social butterfly of a dog, these events might be fun for both of you.
- First, familiarize yourself with dog body language and make sure you can tell when your dog is enjoying the socializing and when they’d rather have some space.
- Along these lines, keep an eye on the body language of the other dogs. Even if your dog is being friendly, if the other dog is not having a good time, it is time to step in and move your dog away.
As far as socialization — whether you have a puppy or an adult — make sure your dog has positive experiences with other dogs and the world in general. Start with a dog friend or two, or go to the outskirts of a dog-friendly event and stay for just part of it. If your dog enjoys that, next time you can try a bit more, but it’s always better to err on the side of caution than for your dog (or others) to have a bad experience.
Besides lots of dog parks and vets, how can local governments make their cities more attractive to dog owners?
- Work to make sure your city has plenty of affordable, pet-friendly housing that does not have breed or weight limits.
- Counterintuitively, have leash laws and enforce those outside of safe, contained, and well-marked off-leash areas. Many dogs do not like being approached by off-leash dogs, so leash laws can greatly increase the comfort and safety of dogs and their owners.
- Along with that, be sure there are appropriate designated areas for dogs to run and play off-leash. Larger, fenced areas are preferred.
- Have natural areas (green space) — this will benefit both pets and people.
- Make sure you do not have discriminatory breed-specific legislation in place.
What are the three most important considerations when adopting a dog?
- Pick a dog that is well-suited to your home and lifestyle — consider the individual rather than stereotypes.
See if the shelter has notes about what that individual is like in a home, and if they don’t know a lot about that individual, see if you can foster to adopt to make sure that the dog fits in well with your lifestyle. Dogs often behave differently in the shelter than they will in a home. Consider compatibility with other people and animals in your home as well.
Expect some initial hiccups and remember that your dog will likely need time and guidance to learn to fit into life with you. - Prepare to be patient and be able to invest time and resources into training.
Training classes can be great, especially if you are adding a puppy for the socialization aspect, but lower-cost resources include free YouTube videos like those by Kikopup. Find a trainer who uses positive reinforcement and avoids using fear or pain to train.
Consider adopting an older adult dog that may already have many of the skills (like house training) that make them easy to live with. - Form that bond.
Love your dog for who they are and actively try to find activities that you both enjoy doing together, such as long leisurely walks in the woods or silly play sessions in the house.
Many animal shelters are struggling with increasing pet surrenders as a result of higher housing costs. How can dog owners help their local shelter if they can’t bring home any more pups?
- Foster. Temporarily caring for an animal can improve that animal’s welfare, help network the animal, and help the shelter learn more about how that animal behaves in a home. Many shelters even offer short-term fostering opportunities as well, such as taking a dog home just for a weekend or taking care of an animal while the regular foster is traveling.
- Volunteering. Whether it’s walking dogs, petting cats, or helping at adoption events, most shelters offer a variety of opportunities to get involved.
- Donating money or specific items that the shelter requests.
- Advocacy and networking. Let people in your life and community know about specific animals at the shelter that are looking for homes. Sometimes it helps to pick just one and be that animal’s advocate until they find their new home.
What can dog owners do to make sure their pups are socialized before unleashing them around other hounds at dog parks and dog-friendly events?
With any new dog or puppy, gradually and safely introducing them to people who look different from you, children (if you have none), and new sights and sounds to gauge their comfort level is important.
Socialization and positive reinforcement classes are excellent ways for puppies or adult dogs to meet new people and other well-socialized dogs. This provides a controlled environment to practice off-leash exploration and play. These classes provide an opportunity to ensure the dog will recall back to us — no matter how distracting or interesting the setting is — consistently 100% of the time prior to any off-leash activity in a dog park or dog-friendly event.
Many dogs do not do well in unpredictable or chaotic environments (such as dog-friendly events or dog parks) and monitoring their body language for signs of stress while positively reinforcing calm and relaxed behavior is critical. Some dogs will feel most comfortable watching from the “sidelines” on a leash next to their owner, which is absolutely okay.
Besides lots of dog parks and vets, how can local governments make their cities more attractive to dog owners?
As many dogs do not do well in the uncontrolled environment of a dog park, having other ways a dog can still socially engage is important. These may include encouraging pet-friendly businesses where dogs are allowed on a patio area with fresh water as well as shaded resting places near their owner.
More businesses allow indoor access to friendly dogs for socialization. Again, an emphasis must be placed on monitoring for signs of fear and stress to avoid placing a dog in a situation that causes it stress or could put any humans in danger.
What are the three most important considerations when adopting a dog?
- A consideration of one’s lifestyle and home environment and how each may match the personality of the individual dog is important.
- Any underlying health concerns for the dog should be considered as well as the estimated cost of pet ownership. Adopted dogs often have vaccinations and are spayed or neutered, but additional costs must be considered. These include preventatives for fleas, ticks, deworming, and vaccines that have not been completed (or may be needed based on the pet’s lifestyle).
- Finally, all dogs benefit from structured training via group or individual classes (depending on the pet’s personality). These can be invaluable in improving the relationship between the dog and its new “humans.”
Many animal shelters are struggling with increasing pet surrenders as a result of higher housing costs. How can dog owners help their local Humane Society if they can’t bring home any more pups?
Offering to be a shelter foster or volunteer can provide incredible benefits to all.
- Many shelters have no space for additional animals and must rely upon fosters to house pets safely until they can be adopted.
- When we volunteer our time or expertise we may reduce a shelter’s expenses and allow their resources to be directed to immediate shelter needs, even if we cannot bring them home.
Finally, check with your local shelter to see if they are in need of any particular donations such as:
- Environmental enrichment toys.
- Food.
- Bedding.
- Other supplies such as leashes or collars.
What can dog owners do to make sure their pups are socialized before unleashing them around other hounds at dog parks and dog-friendly events?
Socialization starts at an early age and puppies are especially sensitive to new experiences (between roughly 3-16 weeks of age). Taking puppies to well run puppy classes is an excellent way to build socialization experiences with both new people and dogs. No matter the age of the dog, experiences around other dogs should be kept positive to help them form a predictable association. Even with the best socialization it is important to remember that most dogs fall into a category known as “dog-selective”. What this means is while most dogs will enjoy the company of select individuals, they might be frightened and aggressive toward others. When dogs are off leash and interacting with other dogs there should always be supervision to ensure everyone is enjoying the experience. If your dog is frightened or aggressive toward most other dogs it’s also perfectly fine to keep their social group small and find other ways to build in enrichment such as going for low-stress sniff walks.
Besides lots of dog parks and vets, how can local governments make their cities more attractive to dog owners?
Making cities safe and clean for dogs, dog owners, and non dog owners alike should be a priority for dog friendly cities. This means plenty of sidewalks, and walkways with trash cans or pet waste receptacles available for easy use. If restaurants and businesses would like to make their place of business more pet friendly, water bowls and treat stations are a great way to make dogs feel comfortable. Breed bans are not effective, science based, or welcoming to dog owners and should not be considered when planning a city for dogs. Vaccination laws are an important piece of legislation that supports a healthy pet population.
What are the three most important considerations when adopting a dog?
When purchasing a dog from a breeder it’s important to consider the breeders reputation and history. The breeder should be breeding dogs for health and temperament.
When adopting any dog, resources such as space, finances, and time should be taken into consideration. Many of the costs of owning a dog might not be readily apparent such as finding boarding, taking the time to train a dog, dog walkers if the owner can’t be home, and emergency veterinary care to name a few.
Lastly, consider how the dog will fit in your family. Each dog has a unique personality and some will fit better than others. For instance dogs who are fearful of noises and people might not do well in a home with small children.
Many animal shelters are struggling with increasing pet surrenders as a result of higher housing costs. How can dog owners help their local Humane Society if they can’t bring home any more pups?
Supporting your local Humane Society and other local shelters is an important part of keeping a healthy community by keeping dogs and cats off the streets and in homes. Apart from long term foster and financial contributions there are many ways to support the facilities. Short term foster (even just a weekend) can be a great way to give a dog a little vacation from the shelter and reduce their stress. Volunteering time to help walk or play with dogs can be another great way to get involved. Pet food and blanket donations can help with the overall financial burden on shelters as well.
Methodology
To rank 2025’s Best Cities for Dog Lovers, we compared the 500 biggest U.S. cities across 37 metrics.
Our dog lovers metrics covered five core themes:
Care (36%): Our care metrics measure the availability of veterinary and pet service networks. It includes the number of vets, emergency clinics, and specialists, along with groomers, sitters, trainers, and boarding options. Together these metrics show how easy it is to find reliable, professional help for a dog’s health and daily needs.
Community (28%): These metrics capture how a city supports dogs beyond the backyard. We measured access to dog parks, walking routes, and local events such as training sessions and shows. This category also reflects the strength of animal welfare laws, shelter access, and breeder regulations that define a city’s overall dog culture.
Businesses (12%): This category reflects how dog-friendly a city’s commercial spaces are. We counted restaurants, hotels, and shopping centers that welcome dogs, as well as services like pet transport and food delivery.
Housing (16%): We evaluated how well each city’s homes fit life with a dog. We looked at average home and yard size along with the share of rental properties that welcome dogs. More space and flexible housing make it easier for owners to give dogs room to move.
Affordability (8%): We analyzed the cost of core pet services relative to income. This includes prices for grooming, sitting, training, and insurance. Cities that balance affordability with quality make responsive pet ownership accessible to more residents.
We assigned each metric a weight based on its impact. The categories, metrics, and weights are listed in the table below.
Each city earned a score out of 100 for every metric, category, and overall. A city’s Overall Score is the average of its score across all metrics. The city with the highest score ranked No. 1 (best), while the city with the lowest score ranked No. 500 (worst).
Notes:
- The “Worst” among individual metrics may not be No. 500 due to ties.
Sources: U.S. Federal Housing Finance Agency, Realtor.com, LawnStarter, BringFido, Sniffspot, Meetup, Yelp, Reference U.S.A., Michigan State University, Emergency Vet 24/7, American Animal Hospital Association, American Veterinary Medical Association, PetSitter.com, The Real Yellow Pages, Everlife Memorials, The Farmer’s Dog, Pawlicy Advisor, Spots.com, Bailing Out Benji, U.S. Census Bureau, and Care.com
Final Thoughts: Where Dog Life Happens
Dogs don’t care about perfect lawn stripes or fancy landscaping. They care about space to run, sniff, and roll. A well-kept yard gives them that freedom while staying safe and easy to maintain.
It starts with knowing the kind of dog that fits your lifestyle. “Pick a dog that is well-suited to your home and lifestyle: Consider the individual rather than stereotypes,” says Professor JoAnna Platzer of the University of Vermont’s Department of Animal and Veterinary Sciences.
That includes thinking about whether your outdoor space matches your dog’s needs and energy level.
For dogs who benefit from a yard, a secure and familiar space can be just as important as what’s inside the home.
“Many dogs do not do well in unpredictable or chaotic environments, such as dog-friendly events or dog parks,” Dr. Naela Boyer of Kansas State University says. A private yard offers a calm place to explore, train, or simply relax at their own pace.
Even better, it’s a place where you can deepen your bond.
“Love your dog for who they are and actively try to find activities that you both enjoy doing together, such as long leisurely walks in the woods or silly play sessions in the house,” Platzer says.
For many pups, that play starts right in the yard.
Make your yard dog-ready with simple upgrades:
- Install durable, pet-safe grass that holds up to zoomies and digging.
- Remove plants that are toxic to dogs and use pet-friendly fertilizers.
- Add fresh water, a shady spot, and keep grass trimmed to reduce pests and overheating risks.
- Install a barrier or add natural deterrents to keep neighborhood dogs from using your lawn as their bathroom.
- Learn the truth about dog urine spots and how to prevent or treat them without harsh chemicals.
Even small changes can make a big difference for dogs who love having a yard to call their own.
Keep the routine simple. Mow often, rinse urine spots, and hire a local LawnStarter pro when your yard needs a reset.
Media Resources
- High-resolution images of cities
- 2024’s Best Cities for Dog Lovers ranking results
- 2023’s Best Cities for Dog Lovers ranking results
- 2022’s Best Cities for Dog Lovers ranking results
- 2021’s Best Cities for Dog Lovers ranking results
Main Photo Credit: Blue Bird / Pexels / License