Even in the world’s richest economy, there are always people in need. But are there always people willing to give?
The short answer is yes. But as Giving Tuesday approaches, some Americans are more inclined to reach into their hearts and pockets depending on where they live.
So, what are 2022’s Most Generous Cities?
LawnStarter compared 130 of the biggest U.S. cities based on 13 key indicators of philanthropic behavior, from the share of donors to the number of homeless shelters — and even the number of locals who converted their Little Free Library into a food sharing box for hungry neighbors.
Just how generous is your city? Find out in our ranking below, followed by some highlights, lowlights, and a generous helping of wisdom from our panel of experts.
Table of Contents
City Rankings
See how each city fared in our ranking:
| OVERALL RANK | City | Overall Score | Individual Generosity Rank | Community Generosity Rank |
|---|---|---|---|---|
| 1 | Minneapolis, MN | 52.65 | 1 | 22 |
| 2 | Seattle, WA | 50.47 | 6 | 11 |
| 3 | Portland, OR | 50.15 | 2 | 32 |
| 4 | New York, NY | 49.61 | 79 | 1 |
| 5 | Baltimore, MD | 49.05 | 7 | 16 |
| 6 | Washington, DC | 43.59 | 18 | 9 |
| 7 | St. Paul, MN | 43.02 | 5 | 76 |
| 8 | Indianapolis, IN | 43.01 | 10 | 26 |
| 9 | Vancouver, WA | 42.65 | 2 | 107 |
| 10 | Chicago, IL | 42.48 | 39 | 2 |
| 11 | Boston, MA | 42.43 | 19 | 13 |
| 12 | St. Louis, MO | 41.84 | 25 | 7 |
| 13 | Denver, CO | 40.99 | 23 | 17 |
| 14 | Milwaukee, WI | 40.79 | 8 | 62 |
| 15 | Cincinnati, OH | 40.25 | 21 | 21 |
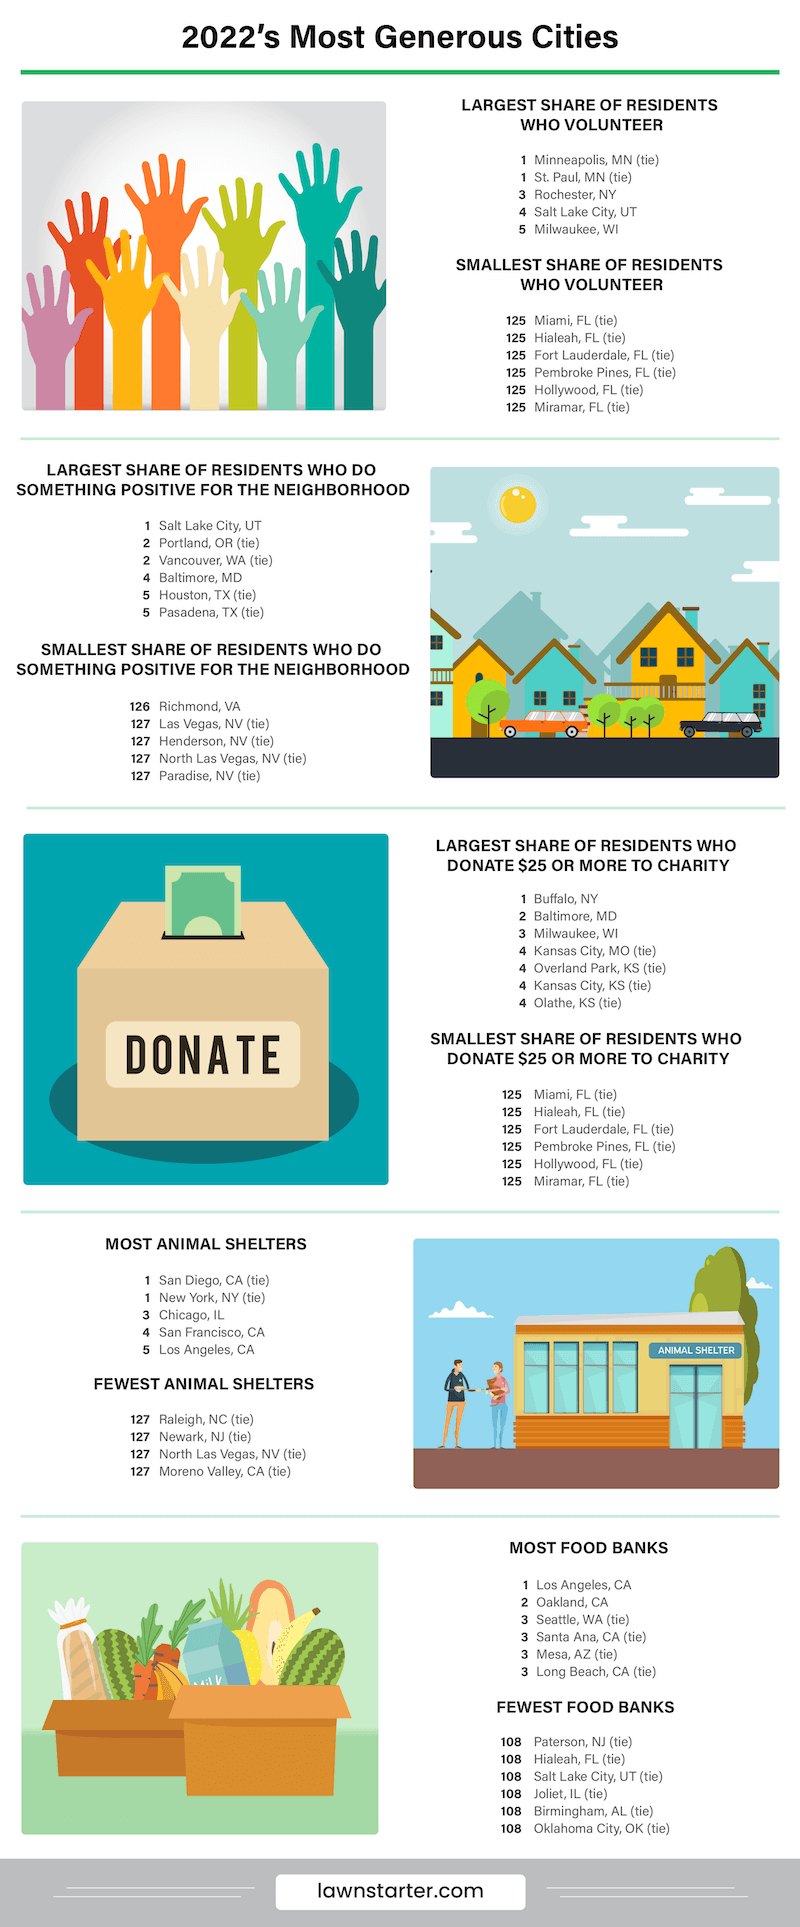
| 16 | Salt Lake City, UT | 40.22 | 4 | 121 |
| 17 | San Francisco, CA | 39.61 | 48 | 4 |
| 18 | Houston, TX | 38.83 | 34 | 8 |
| 19 | Detroit, MI | 38.8 | 40 | 5 |
| 20 | Tacoma, WA | 37.77 | 9 | 69 |
| 21 | Pittsburgh, PA | 37.17 | 22 | 36 |
| 22 | Raleigh, NC | 36.39 | 12 | 57 |
| 23 | Rochester, NY | 35.88 | 11 | 86 |
| 24 | Phoenix, AZ | 35.23 | 50 | 12 |
| 25 | Kansas City, MO | 35.15 | 14 | 66 |
| 26 | Los Angeles, CA | 34.97 | 95 | 3 |
| 26 | Alexandria, VA | 34.97 | 24 | 51 |
| 28 | Pasadena, TX | 34.15 | 34 | 29 |
| 29 | Bellevue, WA | 33.53 | 17 | 79 |
| 30 | Atlanta, GA | 33.48 | 71 | 6 |
| 31 | Providence, RI | 33.44 | 47 | 19 |
| 32 | Oakland, CA | 32.97 | 48 | 20 |
| 33 | Philadelphia, PA | 32.88 | 30 | 47 |
| 34 | Overland Park, KS | 32.66 | 14 | 97 |
| 35 | Cary, NC | 32.38 | 12 | 103 |
| 36 | Memphis, TN | 32.31 | 27 | 64 |
| 37 | Arlington, VA | 32.16 | 26 | 65 |
| 38 | Cleveland, OH | 32.01 | 46 | 25 |
| 39 | Kansas City, KS | 31.63 | 14 | 110 |
| 40 | Charlotte, NC | 31.52 | 31 | 52 |
| 41 | San Jose, CA | 31.36 | 37 | 39 |
| 42 | Olathe, KS | 30.93 | 20 | 106 |
| 43 | Nashville, TN | 30.85 | 28 | 72 |
| 44 | Austin, TX | 30.81 | 38 | 35 |
| 45 | Jacksonville, FL | 30.56 | 29 | 74 |
| 46 | Louisville, KY | 30.44 | 36 | 53 |
| 47 | San Diego, CA | 29.12 | 70 | 23 |
| 48 | Tampa, FL | 28.99 | 54 | 38 |
| 49 | Dallas, TX | 28.84 | 75 | 18 |
| 50 | Jersey City, NJ | 28.54 | 79 | 14 |
| 51 | Birmingham, AL | 27.58 | 60 | 40 |
| 52 | Mesa, AZ | 27.51 | 63 | 37 |
| 53 | Columbus, OH | 27.05 | 51 | 60 |
| 54 | Buffalo, NY | 26.36 | 57 | 43 |
| 55 | Pasadena, CA | 26.26 | 101 | 10 |
| 56 | Murfreesboro, TN | 25.49 | 32 | 119 |
| 57 | Sunnyvale, CA | 25.33 | 33 | 123 |
| 58 | Orlando, FL | 24.81 | 119 | 15 |
| 59 | Naperville, IL | 24.53 | 52 | 80 |
| 60 | Tempe, AZ | 24.18 | 67 | 58 |
| 61 | Norfolk, VA | 24.17 | 41 | 101 |
| 62 | Scottsdale, AZ | 23.97 | 67 | 61 |
| 63 | Long Beach, CA | 23.82 | 96 | 28 |
| 64 | Lakewood, CO | 23.75 | 55 | 90 |
| 65 | Sacramento, CA | 23.71 | 74 | 46 |
| 66 | Torrance, CA | 23.58 | 96 | 31 |
| 67 | Hayward, CA | 23.56 | 61 | 71 |
| 68 | Newark, NJ | 23.38 | 79 | 44 |
| 69 | Aurora, CO | 23.32 | 45 | 111 |
| 70 | Fort Worth, TX | 23.2 | 88 | 41 |
| 71 | St. Petersburg, FL | 23.18 | 59 | 82 |
| 72 | Chesapeake, VA | 22.97 | 41 | 116 |
| 73 | Santa Ana, CA | 22.91 | 101 | 27 |
| 74 | New Orleans, LA | 22.84 | 78 | 50 |
| 75 | Newport News, VA | 22.79 | 41 | 122 |
| 76 | Glendale, AZ | 22.57 | 63 | 83 |
| 77 | Peoria, AZ | 22.56 | 63 | 85 |
| 78 | Aurora, IL | 22.5 | 52 | 113 |
| 79 | Chandler, AZ | 21.89 | 63 | 95 |
| 80 | Virginia Beach, VA | 21.85 | 41 | 128 |
| 81 | Fullerton, CA | 21.67 | 101 | 33 |
| 82 | Anaheim, CA | 21.63 | 101 | 34 |
| 83 | Fremont, CA | 21.48 | 61 | 102 |
| 84 | Plano, TX | 21.21 | 75 | 67 |
| 85 | Oklahoma City, OK | 21.1 | 72 | 75 |
| 86 | Joliet, IL | 20.97 | 58 | 120 |
| 87 | Gilbert, AZ | 20.64 | 67 | 98 |
| 88 | Garden Grove, CA | 20.59 | 101 | 42 |
| 89 | Thornton, CO | 20.41 | 55 | 129 |
| 90 | Yonkers, NY | 20.39 | 79 | 73 |
| 91 | Riverside, CA | 20.33 | 84 | 68 |
| 92 | San Antonio, TX | 20.21 | 100 | 56 |
| 93 | Irvine, CA | 20.06 | 101 | 48 |
| 94 | Las Vegas, NV | 20.03 | 120 | 24 |
| 95 | Chula Vista, CA | 19.98 | 73 | 88 |
| 96 | Glendale, CA | 19.65 | 96 | 63 |
| 97 | Escondido, CA | 19.58 | 85 | 77 |
| 98 | Orange, CA | 19.57 | 101 | 54 |
| 99 | Pomona, CA | 19.54 | 101 | 55 |
| 100 | Oceanside, CA | 19.34 | 85 | 91 |
| 101 | Huntington Beach, CA | 18.85 | 101 | 59 |
| 102 | Elk Grove, CA | 18.84 | 87 | 78 |
| 103 | Arlington, TX | 18.76 | 75 | 99 |
| 104 | Mesquite, TX | 18.67 | 88 | 81 |
| 105 | Paterson, NJ | 18.61 | 79 | 93 |
| 106 | Miami, FL | 17.77 | 122 | 30 |
| 107 | Garland, TX | 17.33 | 88 | 105 |
| 108 | McKinney, TX | 16.97 | 88 | 108 |
| 109 | Grand Prairie, TX | 16.91 | 88 | 109 |
| 110 | Santa Clarita, CA | 16.77 | 96 | 94 |
| 111 | Irving, TX | 16.64 | 88 | 114 |
| 112 | Frisco, TX | 16.63 | 88 | 115 |
| 113 | Lancaster, CA | 16.17 | 101 | 87 |
| 114 | Richmond, VA | 16.02 | 121 | 49 |
| 115 | Ontario, CA | 15.79 | 113 | 84 |
| 116 | Fort Lauderdale, FL | 15.64 | 122 | 45 |
| 117 | Corona, CA | 15.5 | 113 | 89 |
| 118 | San Bernardino, CA | 15.39 | 113 | 92 |
| 119 | Fontana, CA | 15.16 | 113 | 100 |
| 120 | Rancho Cucamonga, CA | 15.08 | 113 | 96 |
| 121 | Palmdale, CA | 14.38 | 101 | 112 |
| 122 | Metairie, LA | 13.74 | 112 | 118 |
| 123 | Hollywood, FL | 12.49 | 122 | 70 |
| 124 | Moreno Valley, CA | 11.4 | 113 | 130 |
| 125 | Henderson, NV | 10.26 | 128 | 104 |
| 126 | Paradise, NV | 9.69 | 128 | 117 |
| 127 | North Las Vegas, NV | 8.92 | 128 | 124 |
| 128 | Miramar, FL | 8.57 | 122 | 125 |
| 129 | Pembroke Pines, FL | 8.37 | 122 | 126 |
| 130 | Hialeah, FL | 8.24 | 122 | 127 |
Highlights and Lowlights
The Most Selfless Twins
The baseball team isn’t the only saintly thing in the Twin Cities. Minneapolis and St. Paul, Minnesota, truly embody the meaning of “neighborly.” Minneapolis landed in first place both overall and in the Individual Generosity category, while St. Paul finished not far behind in seventh place.
Not only are the residents of these cities the most giving of their time (both No. 1 for volunteering rate), but they also make sure to serve hungry community members with hot meals. Minneapolis ranked No. 6 and St. Paul No. 8 in soup kitchens. They also ranked No. 3 and No. 13, respectively, in sharing box locations that locals set up for their food-insecure neighbors during the pandemic.
Mister Rogers would have had a beautiful day in these neighborhoods.
Bigger Cities, Bigger Need
Bigger cities generally performed better in our ranking than smaller and midsize cities.
That’s because big cities tend to focus on maximizing their collective impact more than their individual contributions. In fact, America’s three biggest cities, New York, Chicago, and Los Angeles in that order, dominated our Community Generosity metrics. Houston, San Francisco, and Washington, D.C., also placed in the top 10 of this category.
With increasing economic inequality, these big cities demonstrate that generosity tends to sprout where it’s needed most.
Florida Falls By the Wayside
Florida sent four cities to our bottom 10, including Hialeah in last place overall. Jacksonville (No. 45) and Orlando (No. 58) are the only two Sunshine State cities to crack the top half.
In the Individual Generosity category, multiple Florida cities tied for last place in four out of six metrics and only barely escaped last place in the other two. Their performance in Community Generosity wasn’t any better, either. The number of animal shelters was the only metric out of seven total in which a Florida city didn’t rank in the bottom 10 or tie for last place.
If you’ve fallen on hard times, don’t head to many Sunshine State cities looking for help — but rest assured your four-legged friends will find a home.
Ask The Experts
We all want to create a better world with our donations, but none of us knows what the future holds, especially with the pandemic raging and lines at food banks growing longer. LawnStarter asked some experts to help us all understand how we can give smarter to help create that brighter future. Read their insightful answers below.
- How can local governments encourage residents to give back to their communities?
- For those who can’t donate money, what are the best ways to show generosity toward others?
- What are the best ways to vet charities and other nonprofit organizations?
- How have changes in tax law covering charitable donations affected giving? Is this why charities are moving to monthly donations by credit cards?
- During the pandemic, where are volunteers needed the most?
- How will the pandemic affect giving in the future?


How can local governments encourage residents to give back to their communities?
Make people aware of the social needs, how much it will cost to meet those needs, and suggest a range that people should consider giving.
For those who can’t donate money, what are the best ways to show generosity toward others?
Volunteering and in-kind donations.
What are the best ways to vet charities and other nonprofit organizations?
How have changes in tax law covering charitable donations affected giving? Is this why charities are moving to monthly donations by credit cards?
The biggest change/drawback for individual giving is the increase in the standard deduction.
During the pandemic, where are volunteers needed the most?
Distributing resources.
How will the pandemic affect giving in the future?
People who are able to give are more likely to give.
How can local governments encourage residents to give back to their communities?
A number of states offer tax credits to incentivize charitable giving within their communities, typically for specific topics like education or community development. However, we find these incentives are not effective at increasing donations.
In terms of giving back to the community more generally, local governments can also host service days, food/toy drives, and donation matching campaigns. Local governments have also been experimenting with crowd funding for local projects with some success.
For those who can’t donate money, what are the best ways to show generosity toward others?
Time is often more valuable than money — volunteering, especially in the pandemic when many people have stopped their usual volunteering — is vital for many organizations. Stocking food pantry shelves, giving blood, and offering your skills like sewing or writing are great examples. Sharing about organizations and their needs through social media is also a great way to help out at no cost.
What are the best ways to vet charities and other nonprofit organizations?
First, the best way is by volunteering with the organization — see their operations firsthand, site visits are another great option to confirm the organization is well run and program-focused.
If you can’t vet the charity in person, sites such as Charity Navigator provide some key metrics to make sure the charity is financially sustainable and following proper accountability practices. Review a charity’s website and its annual report to get a sense of its activities and how it measures and report its impact.
For those with an accounting eye, you can review their Form 990s — the annual reporting form for charities to the IRS. This will let you see their financial breakdowns in more detail.
How have changes in tax law covering charitable donations affected giving? Is this why charities are moving to monthly donations by credit cards?
I don’t see why the recent tax law changes would have caused the push to monthly donations. Monthly donations are predictable so they provide the charity with more stability and the ability to plan their annual revenues better.
Because of the pandemic, charities have had to stop most in-person fundraisers and so pushing online giving is a means to make up some of that loss.
During the pandemic, where are volunteers needed the most?
Volunteering with your local food bank or food pantry, sewing reusable masks, checking in on seniors, and handing out or delivering food to students and seniors are all high needs now.
Another high need is around virtual volunteering — as schools remain closed for many, students are losing out on vital socialization and education. Volunteering as a virtual tutor or baby-sitter to interact with kids is a great gift to provide.
How will the pandemic affect giving in the future?
Always hard to predict — we will be dealing with the pandemic and its aftermath, both from a health and an economic standpoint for years.
As many foundations pivot to focus on alleviating these issues, there will be cuts to other areas of need. Minimizing these gaps to other areas will be key.
How can local governments encourage residents to give back to their communities?
Use social media, TV news, and public service announcements (PSAs) to highlight people and areas in need of citizens’ help. Be diverse in individuals, neighborhoods, and causes selected to focus on. Inform citizens on how and when to help — contribute time, money, food, clothing, etc.
Highlight success stories of volunteerism efforts — from perspective of the needy served, from perspective of volunteer(s). Spotlight real people in need, and howeveryday citizens come to the rescue. Awards and certificate events are also effective.
For those who can’t donate money, what are the best ways to show generosity toward others?
Give of your time and talents. Focus on acts of kindness to those who are lonely, forgotten, and ignored — a phone call, a card, a handwritten note or drawing, sing songs or play music, offer to read, take a walk, share a good story, make a cake, bring a pet, offer to go to the grocery for them.
It’s the simple things that so many people take for granted that are missing in needy people’s lives.
It’s also important to feature givers of all ages and from diverse socioeconomic backgrounds.
Feature recipients filled with joy and gratitude at unexpected help from both friends and strangers.
What are the best ways to vet charities and other nonprofit organizations?
Determine whether your state or local government requires an annual financial report from a nonprofit organization and makes the report readily available to the public.
If so, check to see what proportion of the group’s finances are spent for overhead rather than direct aid. Check with the local Better Business Bureau to see if there have been complaints filed against the organization.
If itt is possible, talk to individuals who have volunteered with the organization over the years and ask why they continue to do so. Likewise, talk to individuals who have benefited from help from the organization and identify how it made them feel.
How have changes in tax law covering charitable donations affected giving? Is this why charities are moving to monthly donations by credit cards?
I am not very familiar with the tax code, but monthly donations by credit card fits the spending patterns of most Americans. It also allows the charity to ask a person to give “only $xx a month,” then stress overall result by year’s end. For example: Give $5 per month to feed xx hungry children.
During the pandemic, where are volunteers needed the most?
Anywhere that is serving the most basic needs of people that are being negatively impacted by the pandemic –food, clothing, housing, health care (including mental health), child care, transportation, and job fairs.
How will the pandemic affect giving in the future?
That depends on whether the contributor believes the gift was well utilized and very helpful in reaching the individuals in need.
How can local governments encourage residents to give back to their communities?
By making the community aware of the needs and helping to make it easy to participate or give.
Through a website dedicated to the issues at hand, or a media campaign that focuses on the highest need areas, the local governments can present issues to the community and suggest ways for community members to participate in the resolution of these concerns.
For those who can’t donate money, what are the best ways to show generosity toward others?
Volunteer. There are so many ways to help that are not financial. Read to children in Early Head Start, visit the elderly and deliver meals through Meals on Wheels, or mentor a youth member through the Boys and Girls Club. Sometimes the gift of time is more important than a financial contribution.
Find out the major needs in your community and see how you can address them. Visit a social service agency and see what volunteer opportunities they have. Make yourself available and open to different possibilities.
Besides helping the agency, it will help you feel more connected to the community and actually has been shown to positively impact your health.
What are the best ways to vet charities and other nonprofit organizations?
There are several ways to vet charities and other organizations.
The first one is to see if they receive funding from United Way. United Way has a very detailed and comprehensive vetting process, so if an agency receives funds from them you can most likely be sure that they are an agency using their funds effectively and for the good of their client population.
A second way is to look at the financials of the charity. How much does the executive director make? Is it comparable to other agencies in the area? How much of their funding goes to direct services to clients? Are the administrative costs high in comparison?
And then spend a few hours there and see how they run. Don’t necessarily do anything, just observe. This will tell you a lot about how they function and how well they serve their population.
How have changes in tax law covering charitable donations affected giving? Is this why charities are moving to monthly donations by credit cards?
Not being able to deduct as much due to the changes in the tax laws is a determent to people donating, but if you get to know the charity you’re interested in, that might not be so much of an issue.
Monthly donations by credit card makes donating simpler. I think that making it easy for people to donate helps charities be more efficient.
During the pandemic, where are volunteers needed the most?
I would say that this depends on your community. Food banks always need assistance. There are many more people requesting help because of the pandemic, so this is a good place to start.
But there are other places that need more help as well.
Check out your local animal shelter. People abandon their pets when money is tight, and the shelter needs folks to assist with those pets who have recently lost their homes.
Finally, check out homeless shelters. There are folks in those shelters now that never would have imagined they would end up there a year ago. Evictions are happening due to employment loss. See what those folks need and how you might help at the shelters.
Maybe you have advice to give to clients. Maybe you can help serve meals. There’s lots of need, so there will be something you can do.
How will the pandemic affect giving in the future?
I think it depends on how each individual responds to the crisis.
If someone has donated or volunteered during the pandemic, I would hope that that effort would continue.
Others might feel that they can’t afford the time, energy or money to do anything, or feel that they need to hold their money closer to home.
I think the reaction will be split. Some folks will have recognized the need and will continue to support those causes. Others will not and will feel that they need to focus more on their immediate family and friends.
Both are appropriate responses. I think the pandemic will just emphasize how much we need to make people aware of the needs and remind them that they will continue after the crisis is over.
Methodology
We ranked 130 of the biggest U.S. cities from most generous (No. 1) to least generous (No. 130) based on their overall scores (out of 100 possible points), averaged across all the weighted metrics listed below.
| Metric | Weight | Min. Value | Max. Value | Best |
|---|---|---|---|---|
| Individual Generosity | ||||
| Share of Residents Who Volunteer | 3 | 18.70% | 46.30% | Max. Value |
| Share of Residents Who Do Favors for Neighbors | 2 | 36.00% | 68.70% | Max. Value |
| Share of Residents Who Do Something Positive for the Neighborhood | 2 | 10.90% | 32.90% | Max. Value |
| Share of Residents Who Participate in Local Groups or Organizations | 2 | 14.00% | 43.40% | Max. Value |
| Number of Little Free Library "Sharing Boxes" | 2 | 0 | 7 | Max. Value |
| Share of Residents Who Donate $25 or More to Charity | 1 | 36.70% | 74.10% | Max. Value |
| Community Generosity | ||||
| Nonprofit Organizations per 100,000 Residents | 3 | 16.16 | 2,609.49 | Max. Value |
| Number of Food Banks | 2 | 0 | 12 | Max. Value |
| Number of Food Pantries | 2 | 0 | 141 | Max. Value |
| Number of Soup Kitchens | 2 | 0 | 129 | Max. Value |
| Number of Homeless Shelters | 2 | 0 | 36 | Max. Value |
| Number of Donation Centers | 1 | 0 | 16 | Max. Value |
| Number of Animal Shelters | 2 | 0 | 19 | Max. Value |
Sources: AmeriCorps, Food Pantries, Homeless Shelter Directory, Internal Revenue Service, Little Free Library, Soup Kitchen 411, Inc., and Yelp
Why This Study Matters
It’s sometimes hard to believe we’re still in a pandemic, but COVID-19 cases are rising again as Americans travel for the holidays. On the bright side, many of us are also back at work and earning more.
And yet, for millions of Americans, the pandemic is still — and has been for the past 20 months — very much a reality, despite all the country’s economic gains since December 2020.
Since then, in fact, “nearly 20 million adults live in households that did not get enough to eat” and “12 million adult renters are behind on rent,” according to the Center on Budget and Policy Priorities. From late August 2020, “Some 63 million adults … reported it was somewhat or very difficult for their household to cover usual expenses in the past seven days.”
Thankfully, Americans stepped up in 2020, donating a record $471 billion to charity, up 3.8% from 2019. But more is needed. Earlier this year, The Associated Press reported that over a third of nonprofits are in danger of closing within two years due to financial hardship.
Giving is good for the soul, too. Studies have shown that those who donate time and money are happier and healthier. When we’re generous, everyone wins.
So spread some kindness this Giving Tuesday — and throughout the year.
If you can’t donate cash, there are plenty of other ways to give, such as mowing an elderly or disabled neighbor’s lawn or raking their leaves.
Main photo credit: Shutterstock