The 2026 hurricane season has been unusually quiet, as hostile El Niño winds are keeping overall storm numbers low.
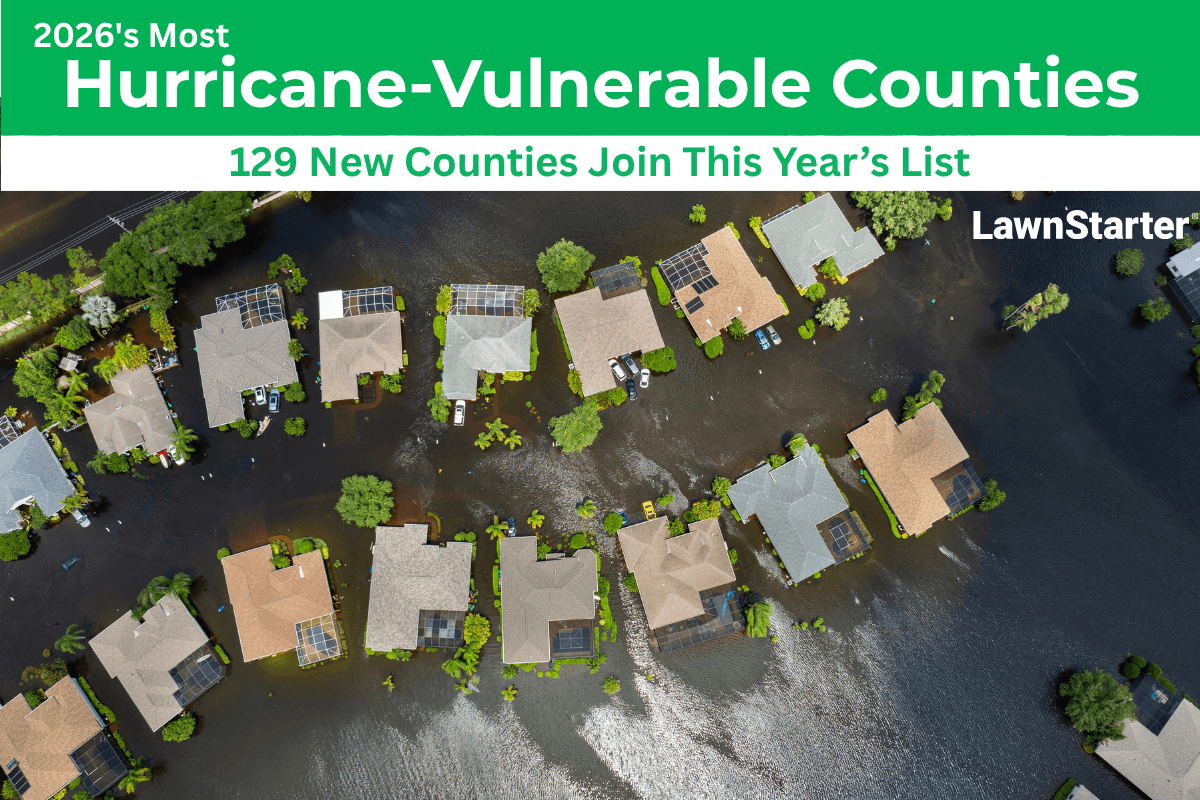
Meanwhile, updated risk data shows that 443 U.S. counties now carry a moderate-to-high hurricane risk score — featuring 129 new counties after a December 2025 update to FEMA’s National Risk Index.
From fallen trees and flying debris to yard flooding, hurricanes take a massive toll on outdoor property. LawnStarter ranked 2026’s Most Hurricane-Vulnerable Counties to show where homeowners need storm preparation the most.
A quiet season doesn’t mean a safe one: AccuWeather’s seasonal forecast flagged the northern and northeastern Gulf and the Carolinas as higher-than-average risk zones this year. Read Ask the Experts below for more.
See where over 400 U.S. counties ranked below. To learn how we ranked them — and why this list only covers counties FEMA rates as relatively moderate to high risk for hurricanes — see our methodology.
Contents
- County Rankings
- 5 Most Hurricane-Vulnerable Counties
- Regional Insights
- Why Did 129 New Counties Move Up FEMA’s Hurricane Risk List This Year?
- Financial Impacts of Hurricane Season
- Ask the Experts
- Methodology: How We Ranked 2026’s Most Hurricane-Vulnerable Counties
- Protecting Your Yard During Hurricane Season
County Rankings
“The biggest mistake new homeowners make when moving into high-risk counties is underestimating the hurricane risk,” says Alex DaSilva, Lead Hurricane Expert and Meteorologist with AccuWeather. “Many people who move or retire to the South have never been in a hurricane before. They may not know all of the necessary action items to prepare for in case of a storm.
“It is very important that residents, new or old, check their evacuation zones every year, as they can occasionally change as new, more accurate surge modeling becomes available to meteorologists and emergency managers.”
To rank the counties, we looked at Hurricane Risk and Expected Annual Loss estimates from FEMA. Our analysis also factors in Hurricane History — the number and severity of hurricanes making landfall over the past 10 years — and Disaster Cleanup (the number of National Disaster Debris Recovery Facilities) to help contrast the lived experience of recent hurricane seasons with FEMA’s forecasting models.
See where each county landed in our ranking:
5 Most Hurricane-Vulnerable Counties
Check out the slideshow below for insights and local tips for our 5 most hurricane-vulnerable counties.

Overall Score: 67.74
Hurricane Risk Score: 99.92 | Rank: 3
Total Number of Hurricanes in Last 10 Years (2016-2025): 2 | Rank: 10 (TIE)
Total Damages Caused by Hurricanes (Expected Annual Loss): Over $300 million | Rank: 3
Local tips: Hurricane Ian made landfall near Lee County in 2022 as a Category 4 storm, and by the time the final toll was confirmed, 71 of the storm’s deaths statewide had occurred in Lee County alone — more than any other Florida county.
Sign up for AlertLee for evacuation notifications, and use the LeePrepares app or check the map from Lee County Emergency Management to confirm your evacuation zone before hurricane season starts rather than during a storm watch.
If evacuation is ordered, I-75 northbound is a primary route inland, and Florida’s Emergency Shoulder Use program has opened the inside shoulder of I-75 northbound to extra traffic during past evacuations, including Hurricane Ian, to help residents evacuate faster.
Read: 11 Hurricane-Resistant Landscaping Ideas for Florida
Photo Credit: U.S. Dept. of Housing and Urban Development / Flickr / Public Domain
Deputy Secretary Todman looks at destroyed homes in Lee County, Florida, after Hurricane Ian.

Overall Score: 62.96
Hurricane Risk Score: 98.41 | Rank: 39
Total Number of Hurricanes in Last 10 Years (2016-2025): 5 | Rank: 1 (TIE)
Total Damages Caused by Hurricanes (Expected Annual Loss): Over $89 million | Rank: 36
Local tips: Terrebonne is protected by the Morganza to the Gulf levee system, but county leaders have cautioned that these are flood-reduction structures, not flood-elimination structures — risk remains even behind the levees, as shown when Hurricane Francine’s 11-foot storm surge overtopped a section near Montegut in 2024.
Sign up for Terrebonne Alert to get evacuation and shelter notifications by text and email. Enter your address on the parish evacuation zone lookup tool to confirm which evacuation zone you’re in.
Read: 11 Hurricane-Resistant Landscaping Ideas for Louisiana
Photo Credit: The National Guard / Flickr / CC BY 2.0
Members of the National Guard distribute water and supplies to residents of Terrebonne Parish, Louisiana, after Hurricane Ida.

Overall Score: 62.72
Hurricane Risk Score: 98.66 | Rank: 33
Total Number of Hurricanes in Last 10 Years (2016-2025): 2 | Rank: 10 (TIE)
Total Damages Caused by Hurricanes (Expected Annual Loss): Over $117 million | Rank: 26
Local tips: Bay County still carries the lessons of Hurricane Michael, a Category 5 storm that caused billions in damage in 2018, and the county now recommends at least 7 days of supplies (food, water, and medication per household member, including pets).
Register for AlertBay to get emergency notifications, and use the county’s evacuation zone map to confirm your home’s evacuation zone.
Bay County Emergency Services also posts free sandbag distribution sites (typically at Frank Brown Park and Harder’s Park) ahead of approaching storms. Bring your own shovel, since supplies are self-serve.
Read: Florida-Friendly Landscaping Ideas
Photo Credit: The National Guard / Flickr / CC BY 2.0
National Guardsmen attempt to clear a fallen tree blocking a road in Bay County, Florida, in the aftermath of Hurricane Michael.

Overall Score: 59.85
Hurricane Risk Score: 99.79 | Rank: 6
Total Number of Hurricanes in Last 10 Years (2016-2025): 1 | Rank: 33 (TIE)
Total Damages Caused by Hurricanes (Expected Annual Loss): Over $250 million | Rank: 8
Local tips: Hurricane Ida struck in 2021 as a Category 4 storm, and Jefferson Parish saw the most reported power outages of any Louisiana parish — nearly 200,000 customers — as the storm knocked out the transmission lines feeding metro New Orleans.
Text JPALERT to 888-777 (or JPNOTICIAS for Spanish-language alerts) to receive parish emergency notifications. If you need shelter information, text LASHELTER to 898211 or call 2-1-1; for storm-related outages, Entergy’s help line is 1-800-368-3749. Confirm your evacuation zone via the parish’s Hurricane Dashboard.
The parish’s hurricane evacuation plan states that no “Last Resort Refuge” shelters are designated for Jefferson Parish or Kenner, meaning residents should plan to evacuate rather than count on a fallback shelter of last resort locally.
Residents without a vehicle can use Jefferson Transit’s public-assisted evacuation, which runs only during mandatory evacuations and brings residents and pets to shelters in northern Louisiana or a neighboring state.
Read: 10 Best Native Plants for Louisiana
Photo Credit: NOAA Satellites / Flickr / Public Domain

Overall Score: 59.69
Hurricane Risk Score: 99| Rank: 25
Total Number of Hurricanes in Last 10 Years (2016-2025): 3 | Rank: 5 (TIE)
Total Damages Caused by Hurricanes (Expected Annual Loss): Over $99 million | Rank: 31
Local tips: Sign up for emergency notifications with Alert Charlotte, and call the Charlotte County Emergency Operations Center at 941-833-4000 with questions about zones or shelters. Use the county’s Know Your Zone tool to confirm your evacuation zone (A–E) well before a storm threatens, since the area’s low elevation means it may not be able to open local shelters at all.
Residents with medical or mobility needs should pre-register for the Special Needs Shelter ahead of storm season, since registration during an active storm watch may not be possible.
Charlotte County Public Works opens self-serve sandbag stations each hurricane season, offering up to 10 free sandbags per household (bring your own shovel).
Read: 47 Florida Native Plants: Flowers, Shrubs, and Trees
Photo Credit: The National Guard / Flickr / CC BY 2.0
National guardsmen exit a Charlotte County Sheriff’s Department chopper after surveying damage from Hurricane Ian.
Regional Insights
Gulf Coast communities make up 72% of the 100 most vulnerable counties. 36 Florida, 19 Louisiana, 10 Texas, 4 Mississippi, and 3 Alabama counties rank among the 100 most vulnerable counties for hurricanes.
- “The first 2 storms of the year impacted this area,” says DaSilva. “While Bertha was overall not that impactful, Arthur broke the all-time 24-hour state rainfall record in Louisiana. So, a lower-than-average season in terms of numbers does not necessarily mean fewer impacts.”
The Southeast fills out most of the rest of the top 100. North Carolina, South Carolina, and Georgia account for 22% of the 100 most hurricane-vulnerable counties. Counties scoring among the 50 most vulnerable include:
- North Carolina counties New Hanover (No. 21 – Wilmington), Brunswick (No. 31), Onslow (No. 39 – Jacksonville), Dare (No. 46 – Outer Banks), and Carteret (No. 49)
- South Carolina counties Charleston (No. 18), Horry (No. 19 – Myrtle Beach), Beaufort (No. 32 – Hilton Head Island), and Georgetown (No. 40)
- Chatham County, Georgia (No. 36 – Savannah)
Severe weather vulnerability extends up the coast for a handful of counties. Sussex County, Delaware (No. 87); the Western Connecticut (No. 91 – Stamford/Danbury) and South Central Connecticut (No. 93 – New Haven) Planning Regions, and New York State’s Kings (No. 90 – Brooklyn), Queens (No. 95), and New York (No. 97 – Manhattan) counties score among the 100 most vulnerable counties.
Pacific Coast counties are absent from this ranking, but that’s a data gap. FEMA doesn’t produce Hurricane Risk Scores for the Eastern Pacific basin, so no West Coast county appears in this ranking. The West Coast simply sees hurricane-strength systems (usually ex-tropical storms) far less often.
6 counties dropped from the list entirely. Honolulu County, Hawaii; Charles and Howard counties, Maryland; and Stafford, Loudoun, and Arlington counties, Virginia, all dropped below the moderate-risk threshold this year. This was likely tied to FEMA’s updated National Risk Index methodology, which changed how the agency calculates historic hurricane loss ratios for counties with limited hurricane-loss history.
A handful of counties are rocketing up the risk list. The biggest jumps in rank from 2025 to 2026 belong to Aransas County, Texas (now No. 53, up from No. 316); Taylor County, Florida (No. 26, up from No. 243); Madison County, Florida (No. 63, up from No. 264); St. John the Baptist Parish, Louisiana (No. 24, up from No. 214); and St. Charles Parish, Louisiana (No. 38, up from No. 204).
Why Did 129 New Counties Move Up FEMA’s Hurricane Risk List This Year?
How FEMA Calculates Hurricane Risk and Expected Annual Loss
Hurricane Risk
FEMA follows an equation for determining a natural hazard risk index across all severe weather events:
| Risk = Expected Annual Loss × ( |
| ) |
Hurricane modeling from Hazus identifies the risk for hurricanes and estimates the potential impact of hurricanes, from physical damage to buildings, infrastructure, and agriculture; social impacts, including displaced citizens and emergency shelter needs; and health impacts of exposure to extreme weather. It also factors in the economic impacts of local business disruption and the cost to reconstruct.
FEMA clusters counties into the following categories based on risk — our ranking only includes counties with “relatively moderate” to “very high” risk of hurricanes:
- Very High: 80th to 100th percentiles
- Relatively High: 60th to 80th percentiles
- Relatively Moderate: 40th to 60th percentiles
- Relatively Low: 20th to 40th percentiles
- Very Low: 0th to 20th percentiles
What changed: In addition to including the latest storm modeling and weather forecasts, FEMA claims that the updated data is partly due to changes in the Social Vulnerability and Community Resilience metrics:
Specifically:
- Social Vulnerability data now comes from the U.S. Census Bureau’s Community Resilience Estimates. FEMA previously used the Social Vulnerability Index (SoVI) from the University of South Carolina.
- Community Resilience data still comes from the University of South Carolina’s Hazards and Vulnerability Research Institute’s Baseline Resilience Indicators for Communities (2020), but FEMA has removed variables associated with race, gender, and ethnicity.
Expected Annual Loss
FEMA defines expected annual loss as “a community’s relative level of expected losses each year when compared to all other communities at the same level.”
FEMA uses another formula to determine the estimates:
- Loss data comes from the Arizona State University Center for Emergency Management and Homeland Security’s SHELDUS™ database and factors in property damage, crop losses, injuries, and fatalities.
129 Counties Added to the List
FEMA recognized the following counties at the end of 2025 as having a “relatively moderate” to “very high” risk of hurricanes:
Financial Impacts of Hurricane Season
| County | Expected Annual Loss | |
|---|---|---|
| 1 | Harris County, Texas (No. 9)Houston | $457.9 million |
| 2 | Miami-Dade County, Florida (No. 20)Miami | $330.6 million |
| 3 | Lee County, Florida (No. 1)Cape Coral | $300.5 million |
| 4 | Palm Beach County, Florida (No. 25)West Palm Beach | $286.9 million |
| 5 | Brevard County, Florida (No. 15)Palm Bay | $281.5 million |
| 6 | Charleston County, South Carolina (No. 18)Charleston | $281.3 million |
| 7 | Broward County, Florida (No. 27)Fort Lauderdale | $280.4 million |
| 8 | Jefferson Parish, Louisiana (No. 4)Kenner | $250.7 million |
| 9 | Orleans Parish, Louisiana (No. 6)New Orleans | $222.9 million |
| 10 | Collier County, Florida (No. 7)Naples | $216.1 million |
While Expected Annual Loss spreads catastrophic risk across quiet years, actual landfalls are non-linear. Damages caused by a single major hurricane can dwarf Expected Annual Loss in a matter of hours. For example, after Hurricane Harvey (2017) hit Harris County, Texas, the residential damage in Houston alone cost an estimated $16 billion.
What Hurricanes Really Cost Homeowners
Before the Storm
Homeowners in hurricane-vulnerable areas are financially impacted before the storm even hits. Permanent upgrades like hurricane shutters, impact-resistant windows, and a generator will each cost thousands of dollars. Seasonal prep like tree trimming and generator fuel costs hundreds of dollars. Not to mention pre-storm supplies like food, water, batteries, and hardware for boarding up the house.
Coastal homeowners also pay thousands of dollars annually in home insurance for hazard and windstorm coverage. Flood insurance can cost an additional hundreds to thousands of dollars a year, depending on where you live.
During the Storm
It can cost families thousands of dollars to evacuate during a hurricane. Gas and 3-7 days (or more) of hotel accommodations, food, pet boarding, and lost wages can be financially devastating in itself.
After the Storm
Just one inch of floodwater can cost upwards of $25,000 in damage, and even for homeowners with insurance, many hurricane policies carry percentage-based deductibles — 2% to 10% of a home’s total insured value — requiring out-of-pocket expenses totaling tens of thousands of dollars before insurance pitches in.
In addition to debris removal and home repair costs, families might need to deal with temporary living expenses for weeks or months living away from home. The financial toll continues with property assessments, increasing insurance costs, and reduced property values in impacted communities.
Ask the Experts
We asked a panel of hurricane and climate experts how Americans can better prepare for storm season and its aftermath. Their full insights are below.
- Alex DaSilva (AccuWeather): Everyone should recheck their evacuation zone every year, since updated surge modeling can shift those boundaries.
- Gregory S. Jenkins (Penn State): Financial and emotional distress from hurricanes falls hardest on lower-income communities, and Black and Hispanic communities face added risk tied to historical policies and practices.
- Joel Cline (NOAA National Weather Service): Stock several days to 2 weeks of shelf-stable food, water, and medication for people and pets, and have a reliable way to get weather alerts, such as hurricanes.gov or weather.gov.
- Jill C. Trepanier, Ph.D. (Louisiana State University): Electronic payments like Venmo can be one of the most useful ways to get money to people who can’t be reached in person but do have internet access after a storm.
- How do you explain the disconnect to residents when seasonal forecasts predict a “quiet” year, but long-term risk maps show their county is more vulnerable than previously thought?
- Are changes in storm intensity, track behavior, or inland moisture retention making counties further off the coast more vulnerable to major damage when storms do make landfall?
- What is the single biggest mistake homeowners in newly designated high-risk counties make when preparing for storm season?
- Given recent trends in rapid storm intensification, what are the top 3 ways homeowners should adjust their hurricane preparation timelines and emergency kits as storms approach?
- Who is most at risk for financial and emotional distress from hurricanes?
- What are the 3 best resources for disaster relief?
- What are the top 3 ways to prepare for a severe hurricane?
- What are the 3 best ways to help those who were affected by a hurricane?
- How can local governments best prepare for increasingly intensifying hurricanes in the U.S.?
Meanwhile, updated risk data shows that 443 U.S. counties now carry a moderate-to-high hurricane risk score — featuring 129 new counties after a December 2025 update to FEMA’s National Risk Index.
From fallen trees and flying debris to yard flooding, hurricanes take a massive toll on outdoor property. LawnStarter ranked 2026’s Most Hurricane-Vulnerable Counties to show where homeowners need storm preparation the most.




Methodology: How We Ranked 2026’s Most Hurricane-Vulnerable Counties
To rank the counties, we compared 443 U.S. counties with a FEMA-designated Hurricane Risk Score of “relatively moderate” to “very high” across 4 categories:
- Hurricane Risk (~36%)
- Hurricane History (~44%)
- Financial Impact (~18%)
- Disaster Cleanup (~2%)
Each factor was assigned a weight based on its impact. The categories, factors, and weights are listed in the table below.
We then evaluated each county using data from the sources listed below the table. Each county received a score (out of 100) for every factor, category, and overall.
A county’s Overall Score is the average of its score across all metrics. The county with the highest score ranked No. 1 (most vulnerable), while the county with the lowest score ranked No. 443 (least vulnerable).
Notes:
- Some metrics and their weights are different compared to analyses from previous years.
- The “least vulnerable” rank among individual factors may not be No. 443 due to ties.
- This ranking covers only the U.S. counties FEMA rates as moderate to high risk for hurricanes — specifically, FEMA’s “Relatively Moderate,” “Relatively High,” or “Very High” Hurricane Risk categories. Counties FEMA rates “Very Low” or “Relatively Low” risk, along with all Pacific Coast counties, don’t appear in this study at all.
- FEMA does not provide Hurricane Risk Scores for the Eastern Pacific Basin, so West Coast counties were excluded from this study.
- This year’s ranking reflects FEMA’s National Risk Index v1.20 data, released December 2025. The dataset carries forward a hurricane-specific Historic Loss Ratio correction FEMA introduced in an earlier update, and adds a 2024 boundary change that replaced Connecticut’s counties with regional planning areas.
- This year’s ranking includes 443 counties, compared to 318 last year, with 129 new additions, 6 counties dropped from the list, and 9 recategorized counties in Connecticut.
- Hurricanes that passed within 100 miles of a county’s center, the average radius of a hurricane, were counted toward that county’s storm history, even if landfall occurred elsewhere.
- Data collection for this story occurred between June 15, 2026 and July 16, 2026.
Sources: Federal Emergency Management Agency, National Oceanic and Atmospheric Administration, and U.S. Environmental Protection Agency
Protecting Your Yard During Hurricane Season
The 2025 hurricane season marked the first in nearly a decade with no major hurricanes making landfall in the continental U.S. While 2026 seems similarly quiet so far (on land), it’s important to stay prepared: Hurricane season typically ends Nov. 30, and it only takes one storm to cause severe damage.
When hurricanes strike, your yard can be either a hazard or a first line of defense. A well-maintained, storm-ready landscape helps absorb heavy rainfall, reduces severe runoff, and withstands high winds.
Here is how you can safeguard your property before a severe storm and help your lawn recover in its aftermath.
Before the Storm: Proactive Yard Defense
- Walk your yard to identify hazards and build a prep checklist.
- Remove dead branches and trim trees regularly to reduce the risk of downed limbs and roof damage.
- Use wind-resistant landscaping with sturdy trees and deep-rooted native plants and ground covers.
- Replace gravel mulch with bark or rubber mulch that won’t become flying debris. Use our mulch calculator to find the perfect mulch for your property.
- Reinforce fencing or replace old posts to reduce collapse risk.
- Clean gutters and keep drains clear to prevent yard flooding.
- Explore other methods for hurricane-resistant landscaping, such as using salt-tolerant plants.
- Secure or store patio furniture, grills, and décor if a storm’s approaching.
After the Storm
- Wear protective gear like heavy-duty gloves and boots, and clean up your yard and rake away storm debris.
- Flush the saltwater out of your yard with fresh water to reduce saltwater intrusion.
- Aerate your lawn once the ground dries to help relieve compacted soil.
- Hold off on fertilizer for 3-6 weeks after a major storm, or at least until the lawn shows signs of active recovery (new blades emerging).
Stay Safe
Important: Keep up to date with your local forecasts and evacuation plans, since a below-normal season doesn’t mean a storm-free one. Create a hurricane plan with your household and stay informed about your local evacuation zone and routes.
Wherever you’re located, know that a NOAA weather radio with battery/crank backup will keep you informed if power and cell service go down.
Main Photo Credit: Image by bilanol via Adobe Stock (license), modified by Sav Maive (text added)
Related Posts: