
Sleigh bells are ringing, snow is glistening, while Mariah Carey serenades shoppers at department stores — it’s the most wonderful time of the year.
Which of the 200 biggest U.S. cities most resemble a scene out of a Hallmark movie?
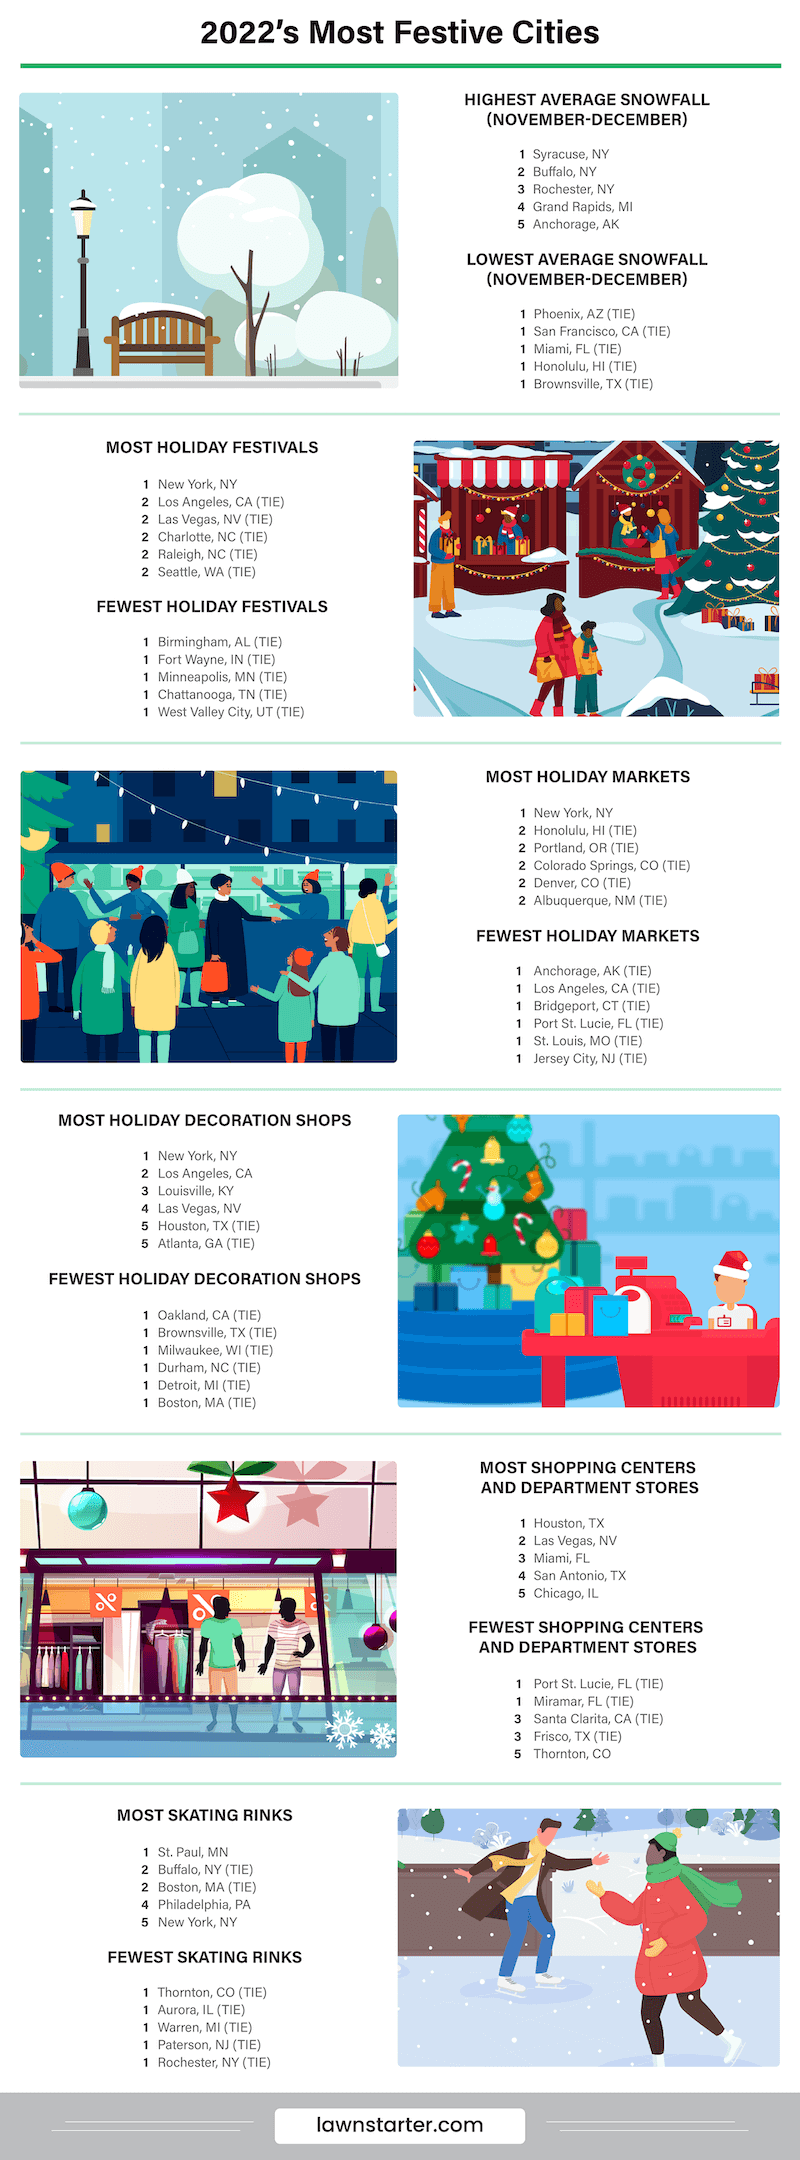
LawnStarter made a list of 2022’s Most Festive Cities and checked it twice. We looked for cities with bags of fun, like holiday festivals and European-style Christmas markets serving delicious goodies.
Of course, no winter wonderland is complete without snow, so we also measured the average snowfall in each city to find the most Instagram-worthy backdrops.
Check out our ranking below, followed by some highlights, lowlights, and expert holiday planning tips.
Contents
- City Rankings
- Highlights and Lowlights
- Ask the Experts
- Behind the Ranking
- Holiday Markets in America
City Rankings
See how each city fared in our ranking:
| Overall Rank (1=Best) | City | Overall Score | Frolicking Rank | Merrymaking Rank | Entertaining Rank | Eating and Drinking Rank | Shopping Rank |
|---|---|---|---|---|---|---|---|
| 1 | New York, NY | 82.99 | 8 | 1 | 1 | 1 | 1 |
| 2 | Las Vegas, NV | 50.66 | 131 | 2 | 4 | 4 | 2 |
| 3 | Los Angeles, CA | 49.96 | 68 | 3 | 2 | 3 | 20 |
| 4 | Chicago, IL | 49.18 | 9 | 4 | 8 | 2 | 8 |
| 5 | Denver, CO | 39.87 | 22 | 5 | 16 | 18 | 7 |
| 6 | Houston, TX | 37.25 | 126 | 33 | 3 | 8 | 9 |
| 7 | San Antonio, TX | 35.66 | 173 | 9 | 5 | 10 | 14 |
| 8 | San Diego, CA | 33.88 | 87 | 13 | 6 | 7 | 16 |
| 9 | Charlotte, NC | 33.53 | 188 | 7 | 14 | 39 | 6 |
| 10 | Philadelphia, PA | 32.69 | 23 | 6 | 33 | 6 | 44 |
| 11 | Seattle, WA | 31.96 | 41 | 8 | 28 | 9 | 23 |
| 12 | Portland, OR | 30.04 | 59 | 28 | 31 | 13 | 4 |
| 13 | Colorado Springs, CO | 29.92 | 79 | 14 | 24 | 61 | 10 |
| 14 | Boston, MA | 28.86 | 5 | 16 | 143 | 12 | 28 |
| 15 | Austin, TX | 28.81 | 147 | 19 | 10 | 17 | 25 |
| 16 | San Francisco, CA | 27.85 | 38 | 21 | 34 | 5 | 33 |
| 17 | Albuquerque, NM | 27.78 | 105 | 18 | 41 | 37 | 5 |
| 18 | Raleigh, NC | 27.65 | 151 | 10 | 35 | 45 | 12 |
| 19 | Honolulu, HI | 27.34 | 71 | 32 | 86 | 20 | 3 |
| 20 | Dallas, TX | 26.82 | 121 | 35 | 7 | 16 | 27 |
| 21 | Columbus, OH | 25.85 | 65 | 22 | 39 | 23 | 18 |
| 22 | Orlando, FL | 25.40 | 155 | 45 | 17 | 11 | 11 |
| 23 | Phoenix, AZ | 25.39 | 154 | 29 | 9 | 28 | 35 |
| 24 | Washington, DC | 25.15 | 33 | 11 | 50 | 27 | 53 |
| 25 | Omaha, NE | 24.87 | 52 | 61 | 20 | 50 | 13 |
| 26 | Atlanta, GA | 24.21 | 112 | 39 | 12 | 19 | 26 |
| 27 | St. Paul, MN | 23.98 | 19 | 12 | 127 | 59 | 52 |
| 28 | Pittsburgh, PA | 23.95 | 18 | 37 | 68 | 22 | 32 |
| 29 | Buffalo, NY | 23.87 | 2 | 40 | 100 | 36 | 74 |
| 30 | Minneapolis, MN | 23.72 | 10 | 58 | 139 | 31 | 15 |
| 31 | Miami, FL | 23.49 | 53 | 77 | 13 | 15 | 38 |
| 32 | Louisville, KY | 23.34 | 108 | 26 | 18 | 35 | 34 |
| 33 | Jacksonville, FL | 22.93 | 198 | 20 | 26 | 48 | 19 |
| 34 | Detroit, MI | 22.78 | 29 | 15 | 94 | 64 | 61 |
| 35 | Tampa, FL | 22.54 | 96 | 89 | 11 | 29 | 17 |
| 36 | Baltimore, MD | 22.50 | 42 | 36 | 74 | 21 | 24 |
| 37 | Cincinnati, OH | 21.69 | 57 | 44 | 37 | 25 | 36 |
| 38 | Nashville, TN | 21.23 | 165 | 23 | 47 | 26 | 22 |
| 39 | Indianapolis, IN | 20.26 | 83 | 24 | 21 | 40 | 75 |
| 40 | Grand Rapids, MI | 20.02 | 4 | 41 | 60 | 79 | 119 |
| 41 | Syracuse, NY | 19.85 | 1 | 93 | 174 | 68 | 97 |
| 42 | Sacramento, CA | 19.73 | 114 | 63 | 19 | 30 | 42 |
| 43 | Rochester, NY | 19.66 | 3 | 98 | 120 | 41 | 71 |
| 44 | New Orleans, LA | 19.56 | 88 | 25 | 104 | 14 | 46 |
| 45 | Virginia Beach, VA | 19.47 | 115 | 17 | 61 | 63 | 55 |
| 46 | St. Louis, MO | 19.45 | 44 | 27 | 43 | 24 | 93 |
| 47 | Oklahoma City, OK | 19.15 | 141 | 56 | 27 | 44 | 31 |
| 48 | Salt Lake City, UT | 18.97 | 13 | 92 | 73 | 47 | 47 |
| 49 | Tucson, AZ | 18.79 | 139 | 49 | 25 | 38 | 45 |
| 50 | Reno, NV | 17.33 | 76 | 66 | 88 | 67 | 29 |
| 51 | Kansas City, MO | 17.30 | 90 | 65 | 30 | 53 | 49 |
| 52 | San Jose, CA | 17.22 | 99 | 104 | 15 | 32 | 59 |
| 53 | Worcester, MA | 16.94 | 6 | 54 | 183 | 103 | 104 |
| 54 | Providence, RI | 16.59 | 11 | 80 | 186 | 58 | 66 |
| 55 | Scottsdale, AZ | 16.42 | 180 | 55 | 22 | 51 | 64 |
| 56 | Richmond, VA | 16.22 | 74 | 34 | 92 | 77 | 69 |
| 57 | Anchorage, AK | 16.10 | 27 | 30 | 154 | 82 | 115 |
| 58 | Memphis, TN | 16.08 | 164 | 68 | 80 | 43 | 21 |
| 59 | Boise, ID | 15.95 | 73 | 82 | 78 | 78 | 40 |
| 60 | Savannah, GA | 15.88 | 123 | 64 | 124 | 56 | 30 |
| 61 | Mesa, AZ | 15.74 | 150 | 67 | 29 | 74 | 50 |
| 62 | Fort Collins, CO | 15.68 | 49 | 59 | 111 | 109 | 67 |
| 63 | El Paso, TX | 15.66 | 101 | 128 | 32 | 42 | 39 |
| 64 | Charleston, SC | 15.43 | 144 | 62 | 106 | 69 | 37 |
| 65 | Tulsa, OK | 15.31 | 122 | 57 | 44 | 46 | 60 |
| 66 | Cleveland, OH | 15.16 | 12 | 91 | 91 | 34 | 117 |
| 67 | Milwaukee, WI | 15.12 | 15 | 74 | 145 | 33 | 109 |
| 68 | Arlington, TX | 15.01 | 149 | 47 | 52 | 90 | 56 |
| 69 | Akron, OH | 15.01 | 31 | 75 | 167 | 89 | 68 |
| 70 | Aurora, CO | 14.68 | 45 | 84 | 53 | 83 | 78 |
| 71 | Tacoma, WA | 14.53 | 75 | 60 | 163 | 76 | 57 |
| 72 | Madison, WI | 14.40 | 28 | 52 | 126 | 95 | 127 |
| 73 | Greensboro, NC | 14.10 | 168 | 31 | 66 | 86 | 77 |
| 73 | Lincoln, NE | 14.10 | 64 | 86 | 72 | 108 | 63 |
| 75 | Fresno, CA | 13.89 | 124 | 48 | 36 | 70 | 106 |
| 76 | Des Moines, IA | 13.84 | 50 | 76 | 170 | 100 | 65 |
| 77 | Sioux Falls, SD | 13.74 | 55 | 50 | 129 | 131 | 100 |
| 78 | Baton Rouge, LA | 13.66 | 167 | 70 | 59 | 87 | 48 |
| 79 | Toledo, OH | 13.53 | 39 | 51 | 123 | 84 | 139 |
| 80 | Fort Worth, TX | 13.13 | 162 | 148 | 23 | 49 | 54 |
| 81 | Huntington Beach, CA | 13.12 | 82 | 71 | 38 | 134 | 96 |
| 82 | Plano, TX | 12.75 | 117 | 69 | 48 | 111 | 76 |
| 83 | Anaheim, CA | 12.70 | 85 | 53 | 65 | 73 | 114 |
| 84 | Lexington, KY | 12.68 | 95 | 88 | 51 | 72 | 72 |
| 85 | Little Rock, AR | 12.67 | 172 | 43 | 79 | 96 | 84 |
| 86 | Salem, OR | 12.34 | 107 | 129 | 89 | 107 | 41 |
| 87 | Huntsville, AL | 12.32 | 195 | 72 | 49 | 118 | 51 |
| 88 | Long Beach, CA | 12.05 | 58 | 119 | 45 | 52 | 103 |
| 89 | Alexandria, VA | 11.81 | 40 | 106 | 153 | 116 | 94 |
| 90 | Spokane, WA | 11.80 | 26 | 124 | 102 | 55 | 123 |
| 91 | Rockford, IL | 11.43 | 51 | 85 | 188 | 153 | 95 |
| 92 | Dayton, OH | 11.32 | 62 | 157 | 141 | 75 | 58 |
| 93 | Tempe, AZ | 11.10 | 97 | 42 | 148 | 81 | 152 |
| 94 | Aurora, IL | 11.04 | 36 | 120 | 173 | 105 | 102 |
| 95 | Jersey City, NJ | 10.93 | 7 | 154 | 192 | 102 | 165 |
| 96 | Fort Lauderdale, FL | 10.71 | 91 | 83 | 58 | 54 | 121 |
| 97 | Orange, CA | 10.63 | 32 | 181 | 42 | 155 | 135 |
| 98 | Winston-Salem, NC | 10.38 | 127 | 86 | 124 | 88 | 79 |
| 99 | Newark, NJ | 10.36 | 14 | 145 | 185 | 136 | 155 |
| 100 | Wichita, KS | 10.23 | 110 | 103 | 46 | 71 | 107 |
| 101 | Shreveport, LA | 10.09 | 187 | 46 | 69 | 168 | 130 |
| 102 | Torrance, CA | 9.92 | 67 | 172 | 83 | 129 | 80 |
| 103 | Eugene, OR | 9.87 | 102 | 90 | 177 | 106 | 88 |
| 104 | Jackson, MS | 9.73 | 103 | 171 | 194 | 145 | 43 |
| 105 | Henderson, NV | 9.69 | 171 | 105 | 56 | 99 | 86 |
| 106 | Bakersfield, CA | 9.49 | 178 | 81 | 55 | 66 | 113 |
| 107 | Fort Wayne, IN | 9.48 | 69 | 107 | 121 | 149 | 125 |
| 108 | Joliet, IL | 9.48 | 47 | 156 | 147 | 112 | 105 |
| 109 | Riverside, CA | 9.47 | 142 | 79 | 67 | 80 | 128 |
| 110 | Springfield, MA | 9.45 | 20 | 135 | 197 | 169 | 185 |
| 111 | Naperville, IL | 9.30 | 34 | 149 | 105 | 141 | 183 |
| 112 | St. Petersburg, FL | 9.27 | 138 | 125 | 90 | 62 | 83 |
| 113 | Killeen, TX | 9.24 | 48 | 168 | 142 | 192 | 98 |
| 114 | Irvine, CA | 9.23 | 111 | 97 | 96 | 91 | 108 |
| 115 | Overland Park, KS | 9.20 | 80 | 140 | 98 | 133 | 90 |
| 116 | Yonkers, NY | 9.20 | 17 | 169 | 199 | 139 | 167 |
| 117 | Norfolk, VA | 9.18 | 89 | 108 | 180 | 177 | 87 |
| 118 | Lakewood, CO | 9.16 | 46 | 117 | 165 | 114 | 161 |
| 119 | Lubbock, TX | 9.08 | 120 | 113 | 40 | 110 | 137 |
| 120 | Oakland, CA | 9.05 | 60 | 136 | 171 | 60 | 110 |
| 121 | Bridgeport, CT | 9.01 | 21 | 146 | 178 | 161 | 189 |
| 122 | Knoxville, TN | 8.98 | 156 | 100 | 63 | 57 | 111 |
| 123 | Grand Prairie, TX | 8.89 | 163 | 38 | 193 | 190 | 192 |
| 124 | Pasadena, CA | 8.82 | 66 | 143 | 70 | 101 | 141 |
| 125 | Hialeah, FL | 8.74 | 63 | 196 | 113 | 180 | 92 |
| 126 | Stockton, CA | 8.68 | 140 | 94 | 77 | 154 | 118 |
| 127 | Thornton, CO | 8.66 | 24 | 134 | 195 | 200 | 199 |
| 128 | Paterson, NJ | 8.45 | 16 | 195 | 198 | 175 | 193 |
| 129 | Birmingham, AL | 8.42 | 184 | 147 | 71 | 65 | 73 |
| 130 | Tallahassee, FL | 8.40 | 192 | 73 | 76 | 85 | 129 |
| 131 | Irving, TX | 8.39 | 113 | 99 | 81 | 159 | 146 |
| 132 | Fullerton, CA | 8.28 | 25 | 186 | 161 | 179 | 173 |
| 133 | McKinney, TX | 8.27 | 157 | 78 | 64 | 170 | 180 |
| 134 | Fremont, CA | 8.20 | 104 | 112 | 93 | 186 | 120 |
| 135 | Mobile, AL | 8.06 | 183 | 116 | 122 | 125 | 81 |
| 136 | Springfield, MO | 7.90 | 93 | 137 | 75 | 123 | 124 |
| 137 | West Valley City, UT | 7.89 | 35 | 150 | 191 | 197 | 195 |
| 138 | Salinas, CA | 7.86 | 43 | 190 | 133 | 135 | 151 |
| 139 | Pomona, CA | 7.85 | 37 | 173 | 138 | 164 | 190 |
| 140 | Warren, MI | 7.82 | 30 | 193 | 158 | 143 | 197 |
| 141 | Augusta, GA | 7.73 | 72 | 152 | 115 | 137 | 133 |
| 142 | Santa Ana, CA | 7.70 | 70 | 177 | 83 | 104 | 136 |
| 143 | Santa Rosa, CA | 7.63 | 106 | 110 | 144 | 126 | 134 |
| 144 | Amarillo, TX | 7.51 | 56 | 162 | 155 | 150 | 147 |
| 145 | Glendale, CA | 7.50 | 54 | 179 | 109 | 146 | 150 |
| 146 | North Las Vegas, NV | 7.48 | 61 | 131 | 166 | 165 | 188 |
| 147 | Garland, TX | 7.48 | 135 | 95 | 97 | 174 | 175 |
| 148 | Oxnard, CA | 7.20 | 81 | 123 | 160 | 115 | 157 |
| 149 | Vancouver, WA | 7.19 | 116 | 163 | 57 | 122 | 122 |
| 150 | Chattanooga, TN | 7.11 | 186 | 139 | 131 | 94 | 82 |
| 151 | Chandler, AZ | 7.04 | 158 | 109 | 110 | 93 | 148 |
| 152 | Corpus Christi, TX | 6.91 | 159 | 122 | 117 | 113 | 112 |
| 153 | Durham, NC | 6.90 | 174 | 96 | 156 | 127 | 126 |
| 154 | Bellevue, WA | 6.90 | 92 | 130 | 168 | 132 | 131 |
| 155 | Chesapeake, VA | 6.87 | 182 | 155 | 103 | 183 | 85 |
| 156 | Clarksville, TN | 6.81 | 190 | 182 | 128 | 187 | 62 |
| 157 | Newport News, VA | 6.52 | 129 | 101 | 184 | 188 | 149 |
| 158 | Montgomery, AL | 6.48 | 196 | 111 | 176 | 172 | 99 |
| 159 | Escondido, CA | 6.45 | 119 | 164 | 62 | 148 | 160 |
| 160 | Roseville, CA | 6.40 | 145 | 141 | 112 | 147 | 116 |
| 161 | Columbus, GA | 6.36 | 200 | 121 | 164 | 163 | 89 |
| 162 | Ontario, CA | 6.35 | 109 | 127 | 150 | 120 | 174 |
| 163 | Modesto, CA | 6.23 | 118 | 161 | 95 | 117 | 140 |
| 164 | Hayward, CA | 6.21 | 86 | 191 | 82 | 173 | 153 |
| 165 | Santa Clarita, CA | 6.15 | 125 | 159 | 54 | 119 | 196 |
| 165 | Chula Vista, CA | 6.15 | 98 | 178 | 108 | 92 | 132 |
| 167 | Peoria, AZ | 6.10 | 176 | 102 | 114 | 191 | 184 |
| 168 | Fontana, CA | 5.94 | 137 | 133 | 87 | 199 | 186 |
| 169 | Surprise, AZ | 5.91 | 193 | 176 | 179 | 195 | 70 |
| 170 | Garden Grove, CA | 5.85 | 77 | 197 | 149 | 130 | 172 |
| 171 | Pembroke Pines, FL | 5.82 | 160 | 118 | 137 | 155 | 168 |
| 172 | Fayetteville, NC | 5.77 | 194 | 115 | 118 | 124 | 138 |
| 173 | Murfreesboro, TN | 5.70 | 175 | 170 | 169 | 196 | 91 |
| 174 | Carrollton, TX | 5.68 | 132 | 132 | 136 | 167 | 178 |
| 175 | Macon, GA | 5.66 | 189 | 151 | 134 | 181 | 101 |
| 176 | Kansas City, KS | 5.63 | 100 | 138 | 151 | 184 | 194 |
| 177 | Elk Grove, CA | 5.59 | 169 | 126 | 99 | 185 | 182 |
| 178 | Glendale, AZ | 5.58 | 153 | 153 | 116 | 98 | 145 |
| 179 | Denton, TX | 5.46 | 152 | 114 | 189 | 176 | 169 |
| 180 | Laredo, TX | 5.17 | 143 | 165 | 101 | 157 | 166 |
| 181 | Hollywood, FL | 5.16 | 94 | 175 | 187 | 97 | 156 |
| 182 | Frisco, TX | 5.06 | 166 | 142 | 107 | 152 | 180 |
| 183 | Sunnyvale, CA | 5.02 | 78 | 187 | 196 | 182 | 177 |
| 184 | McAllen, TX | 4.94 | 128 | 160 | 172 | 166 | 144 |
| 185 | Corona, CA | 4.80 | 148 | 185 | 85 | 162 | 171 |
| 186 | San Bernardino, CA | 4.72 | 136 | 174 | 162 | 138 | 142 |
| 187 | Rancho Cucamonga, CA | 4.60 | 134 | 187 | 130 | 158 | 159 |
| 188 | Oceanside, CA | 4.55 | 146 | 167 | 146 | 142 | 176 |
| 189 | Olathe, KS | 4.51 | 84 | 194 | 181 | 198 | 191 |
| 190 | Waco, TX | 4.42 | 179 | 158 | 140 | 144 | 162 |
| 191 | Pasadena, TX | 4.32 | 130 | 198 | 135 | 178 | 170 |
| 192 | Brownsville, TX | 4.12 | 161 | 183 | 152 | 140 | 143 |
| 193 | Hampton, VA | 3.94 | 133 | 183 | 182 | 194 | 158 |
| 194 | Mesquite, TX | 3.86 | 170 | 166 | 190 | 151 | 154 |
| 195 | Cape Coral, FL | 3.79 | 197 | 144 | 159 | 121 | 163 |
| 196 | Moreno Valley, CA | 3.36 | 181 | 200 | 132 | 160 | 187 |
| 197 | Lancaster, CA | 3.35 | 185 | 180 | 157 | 128 | 163 |
| 198 | Palmdale, CA | 3.25 | 191 | 192 | 119 | 189 | 179 |
| 199 | Miramar, FL | 2.21 | 177 | 199 | 200 | 193 | 200 |
| 200 | Port St. Lucie, FL | 2.03 | 199 | 189 | 175 | 171 | 198 |
Highlights and Lowlights
Christmas in New York
Kids from 1 to 92 will find it hard to sleep in The City That Never Sleeps. New York is our No. 1 most festive city for the second year in a row.
Earning over 32 points more than Las Vegas, our silver-bell medalist, the Big Apple dominated four out of five categories in our holiday ranking.
Even though New York placed eighth in “Frolicking,” no other city holds a fir-scented candle to America’s most popular tourist destination. It would take a miracle on 34th Street to beat the city with the most holiday festivals, attractions, music venues, gift shops — you name it.
Only in New York will you find time-honored traditions like the Macy’s Thanksgiving Day Parade, the Rockefeller Center Christmas Tree lighting, and the Times Square Ball Drop. So, if you want a unique holiday experience, add New York to your bucket list.
Polar Opposites
Baby, it’s warm outside in some of our top 10 cities. If you loathe snow, Las Vegas (No. 2), San Antonio (No. 7), and San Diego (No. 8) will not only keep you toasty, but they’ll warm up your holiday spirit, too.
The average snowfall between November and December in these cities ranges from nada to less than a fifth of an inch. There’s no shortage of holiday cheer, though. Each of these cities ranked in the top 20 of every category except “Frolicking,” as expected.
To rub icy elbows with your pal Jack Frost, head to Upstate New York. Syracuse, Buffalo, and Rochester are true winter wanderlands, boasting excellent walk scores and the highest average snowfalls among all 200 cities. The region already hit an icy milestone, a historic 4 feet of snow in a single day, back in November.
There’s plenty of merrymaking to be had in these frigid cities, but you’ll need the warmest pair of winter boots — or even snowshoes — and a well-insulated coat.
Where the Grinch Stole Christmas
Crowd-averse residents of several California, Florida, and Texas cities can enjoy more than one silent night this holiday season. Three cities from each of these states make up most of our bottom 10.
Let’s just say St. Nick won’t be stopping by Port St. Lucie, the least festive city of all. He might skip over cities on the outskirts of Greater Los Angeles, Houston, and Dallas, too, along with Brownsville, Texas.
What went wrong? Each of these cities is lacking in most holiday-themed anything — with a few exceptions. Cape Coral, Florida, sped past 155 cities in holiday-themed races. Moreno Valley, California, made its merry way to 63rd place in party supply stores, while Mesquite, Texas, gave a nutcracking performance in number of bakeries, at No. 65.
Where these cities really shine: low crime. If you’re home alone this holiday season, you can forget setting up booby traps in one of our least festive cities, especially Port St. Lucie and Cape Coral, our third and seventh safest cities overall.
Ask The Experts
A few travel smarts can go a long way, especially during the holiday season. We turned to a panel of travel experts for tips and insights. Read their thoughts below.
- What are some holiday trends, if any, that you’ve observed this year?
- Why aren’t Christmas markets more prevalent in the U.S.?
- What is the best way to avoid tourist traps and discover a city’s hidden gems?
- Where are the best places to do last-minute holiday gift shopping?
- How far in advance should consumers book their winter holiday travels to avoid paying more for flights and hotels?


What are some holiday trends, if any, that you’ve observed this year?
After being cooped up during pandemic restrictions, people are excited to travel and will travel farther to visit family or go to a long-desired destination. One trend is the huge demand for travel despite inflation-spiked rates.
The pandemic has underscored the necessity of seizing the moment and the importance of spending and cherishing time with family and friends. A concept called “socioemotional selectivity” suggests that when our mortality is spotlighted, we’ll seek out our dearest friends and family with whom to spend our precious moments. People are “zoomed” out and ready for these meaningful in-person interactions, so expect busy holiday travel as a result.
Why aren’t Christmas markets more prevalent in the U.S.?
There are two primary reasons why Christmas markets aren’t more prevalent in the U.S. Given the longer history of towns and cities in Europe, European countries boast a much longer tradition of holiday market shopping compared to the U.S. Additionally, the U.S. system of city planning centers on shopping malls and big box stores in contrast to European cities that typically have a more centralized market square with less traffic and roadways.
This allows for a more open space for a “charming” market feel than U.S. main streets with busy roads and large road dividers. One exception in the U.S. is Leavenworth, Washington which is a Bavarian Christmas-themed town that has a series of small roads and lanes with sidewalks on both sides to encourage walking and strolling to window shop.
What is the best way to avoid tourist traps and discover a city’s hidden gems?
No joke but one of the best ways to discover a city’s hidden treasures is by talking to your hotel concierge or BnB host, as well as restaurant servers and bartenders. Hospitality people know the city the best!
Where are the best places to do last-minute holiday gift shopping?
Go to your chamber of commerce website for announcements on holiday shopping events. If you prefer alternative giving, see what your local nonprofits are doing –– they may have a holiday giving market. And, of course, visit your local stores to support the local economy and community. Not only will you be giving a unique local gift, but you will be helping local vendors and artists.
How far in advance should consumers book their winter holiday travels to avoid paying more for flights and hotels?
This has been a challenge the past year. When possible, try to book several months in advance of your planned travel. Additionally, if you can be flexible on your arrival and departure days, certain days of the week tend to be less expensive. For instance, traveling on Saturdays tends to be the most expensive. A general rule of thumb is to book no less than two weeks prior to travel, with more time from booking date to departure date providing the best prices.
What are some holiday trends, if any, that you’ve observed this year?
Consumers (including tourists and vacationers) seem to be a bit more conservative with their spending based on the uncertain state of the economy and the potential for a recession in the near future. This follows on the heels of comments from business magnates such as Jeff Bezos, who encouraged people not to make big purchases this season.
Why aren’t Christmas markets more prevalent in the U.S.?
With so many consumers today transitioning predominantly to online shopping (especially for non-perishable purchases), traffic for Christmas markets (not unlike shopping malls) is fading.
What is the best way to avoid tourist traps and discover a city’s hidden gems?
Two of the best ways to avoid tourist traps and discover value-oriented points of interest in a vacation destination are to research carefully online before visiting and to talk to locals from the area who do not have an interest in trying to sell something to the would-be tourist.
Talk to restaurant servers, postal workers, taxi or Uber drivers, and others who know the community well but don’t necessarily have a motivation for any kind of personal gain in the conversation.
Where are the best places to do last-minute holiday gift shopping?
This obviously depends largely on what kinds of gifts are being sought, where they can be purchased, and how strong demand is. Shopping online for holiday gifts has become a preferred method for many shoppers. And even last minute gifts can either be delivered in time via expedited shipping or, in the case of gift certificates, event tickets, and other intangibles, delivered electronically via email.
How far in advance should consumers book their winter holiday travels to avoid paying more for flights and hotels?
Travel costs will ultimately vary with demand in a particular season. Normally, holiday seasons see heavy demand and consequently drive prices up. However, in unusual years (such as 2020 and 2021 during the COVID-19 pandemic), demand can be unpredictable.
It is generally a good idea to book airfare and other accommodations at least four to six weeks before traveling in order to avoid last-minute price gouging from travel markets. Earlier is generally better, though sales and promotions throughout the months leading up to a trip may also affect the optimal time for booking.
Behind the Ranking
For each of the 200 biggest U.S. cities, we gathered publicly available data on the factors listed in the table below.
We then grouped those factors into five categories: Frolicking, Merrymaking, Entertaining, Eating and Drinking, and Shopping.
Next, we calculated weighted scores for each city in each category.
Finally, we averaged the scores for each city across all categories.
The city that earned the highest average score was ranked “Most Festive” (No. 1), while the city with the lowest was ranked “Least Festive” (No. 200). (Note: The “Least Festive” among individual factors may not be No. 200 due to ties.)
| Metric | Weighting | Lowest Value | Highest Value | Best |
|---|---|---|---|---|
| Frolicking | ||||
| Average Snowfall (in Inches) Between November and December | 3 | 0 | 23 | Highest |
| Walk Score | 2 | 13 | 97 | Highest |
| Crime Index | 0.5 | 0 | 85 | Highest |
| Merrymaking | ||||
| Holiday Festivals | 3 | 0 | 7 | Highest |
| Attractions | 2 | 13 | 5,711 | Highest |
| Music Venues | 1 | 0 | 189 | Highest |
| Ice Skating Rinks | 2 | 0 | 15 | Highest |
| Holiday-Themed Races | 1 | 0 | 13 | Highest |
| Entertaining | ||||
| Holiday Decoration Shops | 2 | 0 | 28 | Highest |
| Holiday Decorating Services | 2 | 0 | 28 | Highest |
| Independent Christmas Tree Vendors | 0.5 | 0 | 44 | Highest |
| Big-Box Christmas Tree Vendors | 1 | 2 | 117 | Highest |
| Party Supply Stores | 1 | 1 | 136 | Highest |
| Eating and Drinking | ||||
| Bakeries | 1 | 0 | 376 | Highest |
| Candy Stores | 1 | 0 | 128 | Highest |
| Nightlife Options | 1 | 0 | 779 | Highest |
| Shopping | ||||
| Holiday Markets | 3 | 0 | 6 | Highest |
| Shopping Centers and Department Stores | 2 | 4 | 219 | Highest |
| Gift Shops | 1 | 2 | 181 | Highest |
| Holiday Card Stores | 0.5 | 0 | 162 | Highest |
Sources: Ace Hardware, Big Lots, Christmas Market Guides, Everfest, FestivalNet, Find Skating Rinks, Hobby Lobby, Home Depot, Kmart, Lowe’s, Menards, Michaels, NeighborhoodScout, National Oceanic and Atmospheric Administration, Running in the USA, Sutherlands, Target, TripAdvisor, True Value, Walk Score, Walmart, and Yelp
Holiday Markets in America
Craving mulled wine, bratwursts, and blintzes? You’re in luck.
Although Christmas markets are a bigger tradition across the pond, they’re catching on here at home. You just might be able to get a taste of this European experience in your own backyard.
Be transported to another continent in one of these holiday markets:
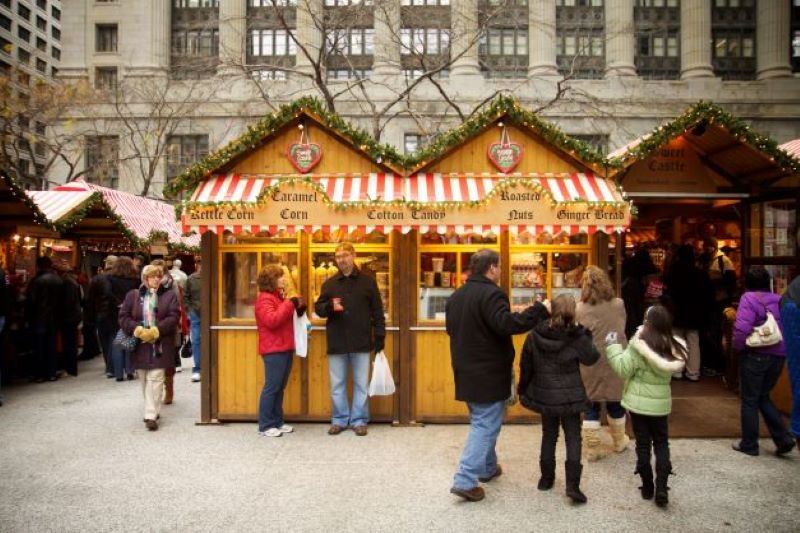
Photo Credit: Marcin Wichary / Flickr / CC BY 2.0
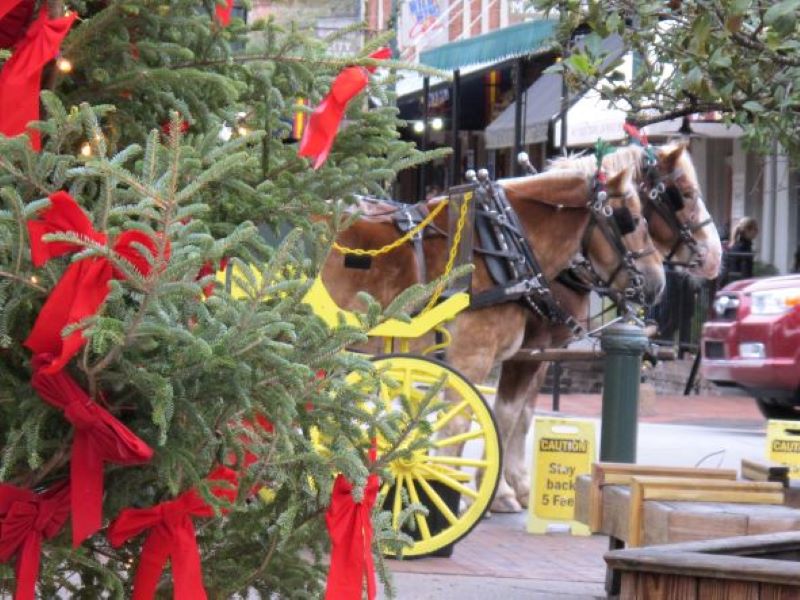
Photo Credit: john / Flickr / CC BY-ND 2.0
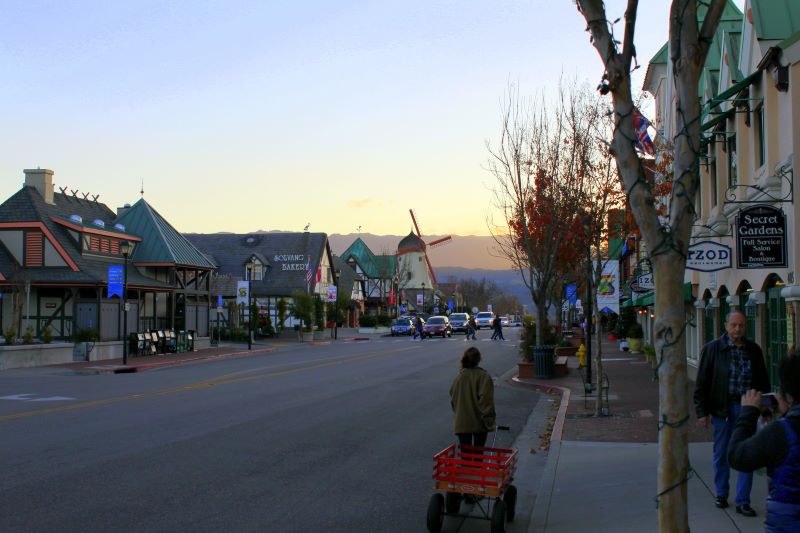
Photo Credit: b r e n t / Flickr / CC BY 2.0
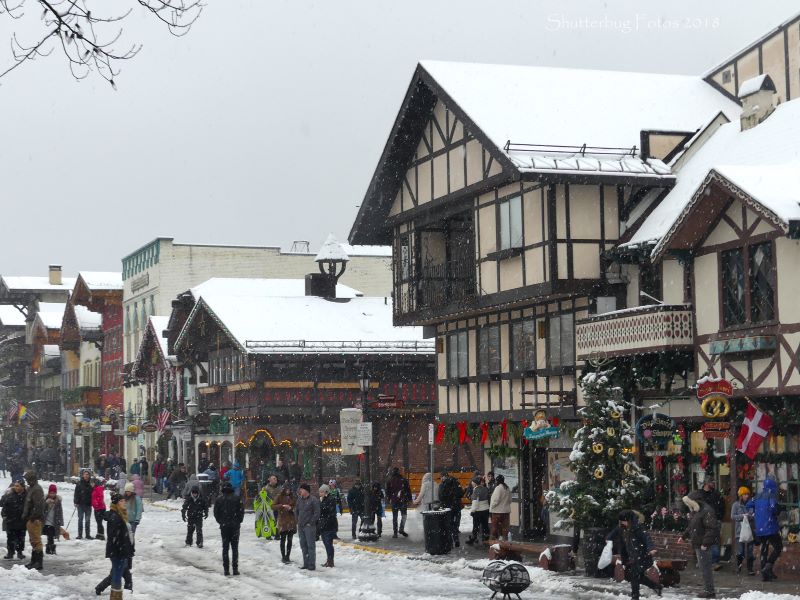

Photo Credit: Opeyemi / Flickr / CC BY 2.0
Photo Credit: David Wilson / Flickr / CC BY 2.0
Photo Credit: Amy Aletheia Cahill / Flickr / CC BY-SA 2.0
Main Photo Credit: Shutterstock