From the air we breathe to how trash and industrial pollution are managed, living in a healthy environment is key to maintaining both physical and mental well-being.
Which U.S. cities aren’t so pristine? To find out, LawnStarter examined 20 metrics to rank 2025’s Dirtiest Cities in America.
Some surprising findings:
😷 10 California cities tie for the worst median air quality.
🚰 Only 39% of the cities in our ranking had no water quality violations.
🚙 An average of 13.89% of residents in ranked cities live near high-traffic roadways.
See where your city scored in our ranking below. To learn how we ranked the cities, see our methodology.
Contents
- America’s 5 Dirtiest Cities
- City Rankings
- Key Insights
- 10 Least Dirty Cities
- Infogram: Metric Breakdown
- Ask the Experts
- Methodology
- Clean, Green Lawn Care
America’s 5 Dirtiest Cities
Check out the slideshow below for highlights on each of America’s top 5 dirtiest cities.
1st = Dirtiest
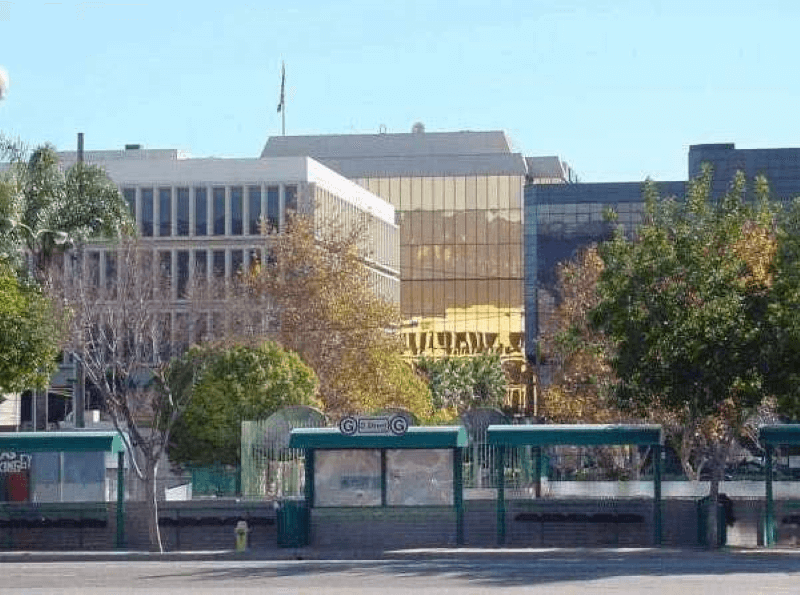
Median Air Quality Index: 97 | Rank: 1 (TIE)
Near-Roadway Pollution: 17.27% | Rank: 75
Number of Junk Yards: 12 | Rank: 37
Share of Residents Dissatisfied with Pollution: 75% | Rank: 1
Local tips: Earlier this year, local college students collected around 500 pounds of trash from the Santa Ana River at a park nearby in Riverside (No. 23).
On the bright side, a new zero-emission passenger train powered by hydrogen is currently being tested and may soon be ready to transport passengers around San Bernardino County.
Photo Credit: House10902 / Wikimedia Commons / CC BY-SA 1.0
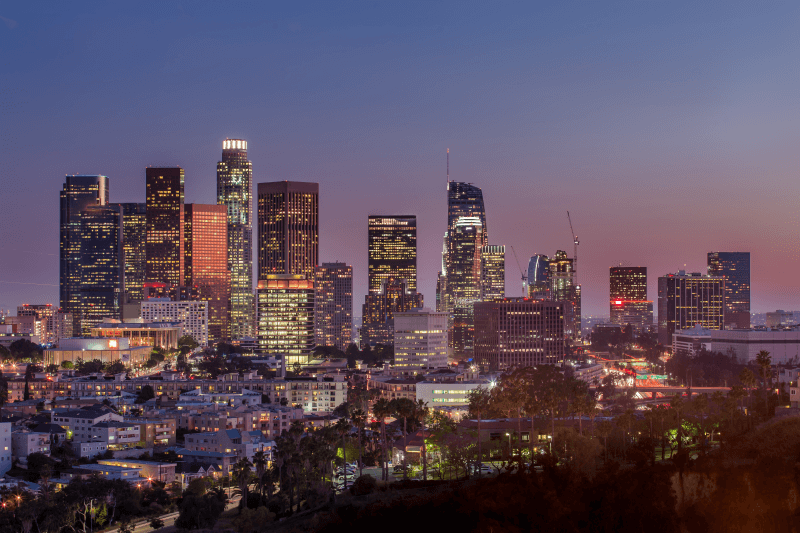
Median Air Quality Index: 75 | Rank: 11
Near-Roadway Pollution: 39.29% | Rank: 4
Share of Overcrowded Homes: 11.14% | Rank: 3
Share of Residents Dissatisfied with Pollution: 50.62% | Rank: 12
Local tips: Help keep the community clean by volunteering with Echo Park Trash Club or at a beach cleanup with Heal the Bay.
Photo Credit: susanne2688 / Adobe Stock / License
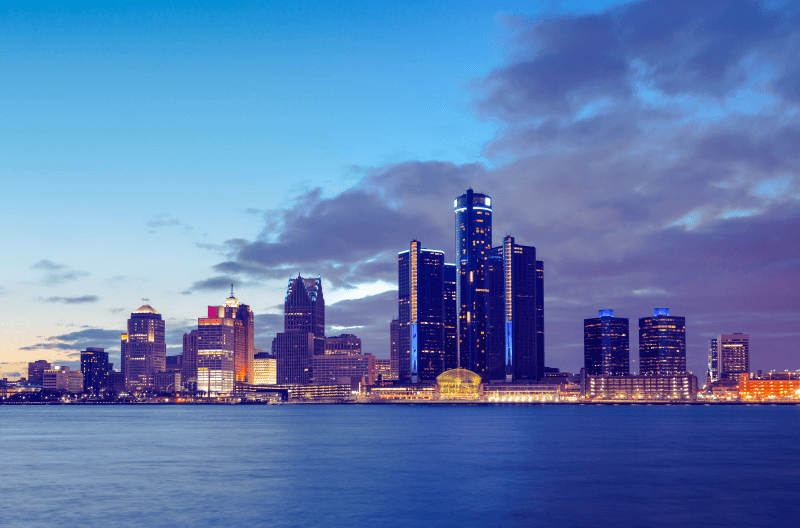
Median Air Quality Index: 53 | Rank: 77
RSEI Score: 0.39 | Rank: 50
Percentage of Smokers: 23.8% | Rank: 4
Share of Residents Dissatisfied with Pollution: 54% | Rank: 9
Local tips: Plan a community beautification and/or cleanup project with Motor City Makeover 365 or get to work at an event hosted by The Cleanup Club.
Photo Credit: espiegle / Adobe Stock / License
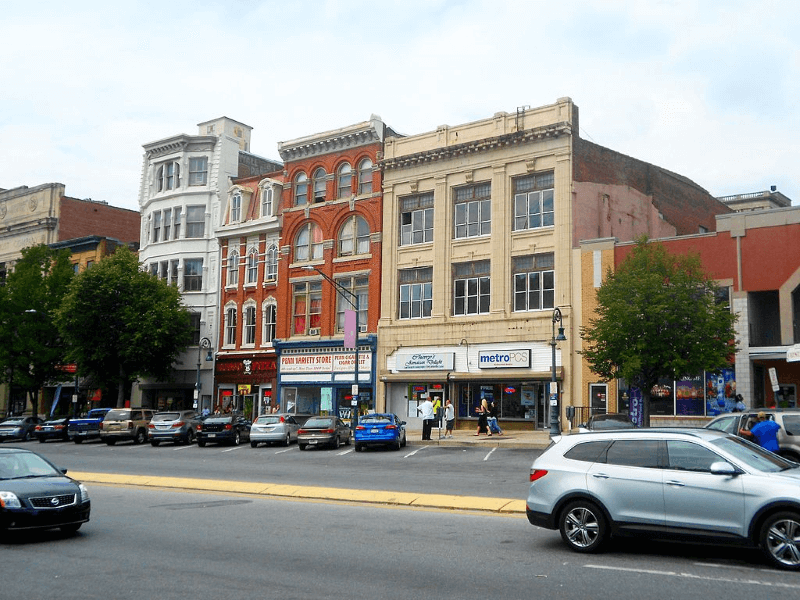
Greenhouse-Gas Emissions (Metric Tons CO2e) per Capita: 18.42 | Rank: 20
RSEI Score: 137.75 | Rank: 1
Percentage of Smokers: 21.2% | Rank: 9
Number of Junk Yards: 5 | Rank: 101
Local tips: Reading has a goal to be powered by 100% renewable energy by 2050, starting with installing over 4,300 solar panels by the end of 2026. The Green Building Alliance has partnered with the city to help achieve that goal and bolster workforce training for green careers.
Photo Credit: Smallbones / Wikimedia Commons / Public Domain
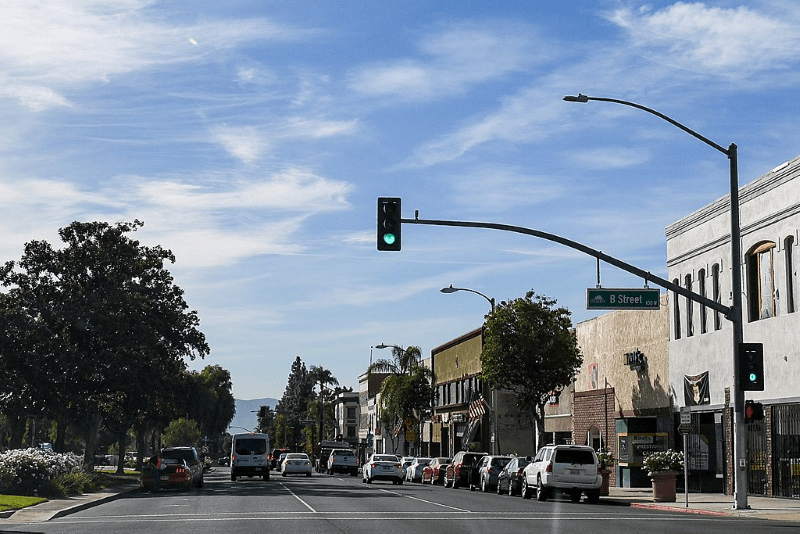
Median Air Quality Index: 97 | Rank: 1 (TIE)
Near-Roadway Pollution: 23.07% | Rank: 38
RSEI Score: 0.4 | Rank: 48
Share of Residents Dissatisfied with Pollution: 60.71% | Rank: 6
Local tips: Sustainable strides are being made in Ontario. The city is home to a net-zero energy community development with 101 units and an LEED-certified distribution center.
Some flights out of Ontario International Airport are now powered by sustainable aviation fuel, which can reduce emissions by up to 80%.
Residents can compost and grow (or buy) fresh produce at Huerta del Valle, Ontario’s “carbon farm.”
Photo Credit: U.S. Department of Agriculture / Wikimedia Commons / Public Domain
City Rankings
See how your city and others fared in our ranking:
Key Insights
Inland Shipping Empire: San Bernardino, California, ranks as the dirtiest city for the 2nd year in a row. Out of the cities in our ranking, San Bernardino has the highest share of residents dissatisfied with pollution — 75% — and ties with 9 other California cities with the worst median air quality.
Research suggests nitrogen dioxide — a harmful pollutant — is around 20% more prevalent near warehouses. 12 cities in San Bernardino County collectively have over 850 large warehouses (100,000 sq ft or larger). The South Coast Air Quality Management District now requires large warehouses to make sustainable investments to offset pollution.
California has been leading the way in sustainable development, from green lawn care to composting to electric energy and technology. However, earlier this year, the Golden State reversed their “clean fleets” mandate for electric trucks. California still offers $120,000 incentives for haulers looking to go electric.
Rust Belt cities like Detroit (No. 3), Reading, Pennsylvania (No. 4), and Flint, Michigan (No. 12), score among the dirtiest cities with high rates of smoking, homes lacking kitchens and plumbing, and a large percentage of residents unhappy with their environment.
10 Least Dirty Cities
Cities at the bottom of our ranking boast decent air and water quality, low excess fuel consumption, and high shares of residents who are satisfied with their local environment and city waste management.
- South Bend, Indiana (No. 303)
- Wilmington, North Carolina (No. 302)
- Des Moines, Iowa (No. 301)
- Davenport, Iowa (No. 300)
- Athens, Georgia (No. 299)
- Winston-Salem, North Carolina (No. 298)
- Fargo, North Dakota (No. 297)
- Frederick, Maryland (No. 296)
- Pleasanton, California (No. 295)
- Lynchburg, Virginia (No. 294)
Healthy Highlights
- \The ideal standard for “good” air quality is an index value of 50 or below. 169 cities in our ranking — including Boston (No. 190), Portland (No. 136), and Minneapolis (No. 277) — fall within this median healthy air quality. The remaining cities — 44% — land within a “moderate” level.
- The national average percentage of adult smokers is 11.6%. 61 cities — including Denver (No. 174), Austin (No. 88), and San Francisco (No. 89) have reported smaller than average populations of smokers.
- Ventura Highways: Near-roadway pollution is least prevalent in Ventura, California (No. 247), followed by Washington, D.C. (No. 127), and Erie, Pennsylvania (No. 48).
Infogram: Metric Breakdown
Ask the Experts
We turned to a panel of experts to learn more about the potential impacts of living in a polluted environment and how to take the initiative to help clean things up.
- In what ways does a dirty city directly affect its residents?
- What steps can cities take to achieve a cleaner environment and better air quality?
- Cleanliness isn’t cheap. How can local governments balance their budgets while spending the necessary funds to keep their cities clean?
- What lessons can we learn from some of the world’s cleanest big cities like Copenhagen and Singapore?
- How can individual residents contribute to a cleaner city?


In what ways does a dirty city directly affect its residents?
I’m not sure what they’re referring to as a dirty city; I’m assuming it is trash related. If it is trash, this attracts vectors which can ultimately lead to illnesses and diseases. Also, just the “dirty appearance” detracts from the community pride.
What steps can cities take to achieve a cleaner environment and better air quality?
In the US, there are many environmental regulations that are intended to protect the public. Compliance with the regulations would be sufficient. However, often the public is not aware of the regulatory requirements. So, it’s often a lack of information sharing of the requirements.
Cleanliness isn’t cheap. How can local governments balance their budgets while spending the necessary funds to keep their cities clean?
That is a difficult task. Funds are usually limited and governmental programs with funding are also in high demand, so many cities are left out. The most important part is educating people about why it’s important so that they comply.
How can individual residents contribute to a cleaner city?
Citizens can contribute by being informed and wanting to be responsible. It’s not a question of needing additional regulation, but rather complying with those that already exist.
In what ways does a dirty city directly affect its residents?
Dirty air implies poor health of the citizens due to excess exposure to polluted air.
What steps can cities take to achieve a cleaner environment and better air quality?
There are two sides that should be considered:
- Reduction of particulate and other air pollutants (ozone, NOx, CO) through rerouting of highways away from densely populated areas, increased use of public transportation, and cleaner transportation and power plants.
- Greening of cities through planting and maintenance of trees and establishing green rooftops. Rerouting transportation may become a moot point as internal combustion engines are made obsolete with electric and hydrogen-powered vehicles.
Cleanliness isn’t cheap. How can local governments balance their budgets while spending the necessary funds to keep their cities clean?
Planting trees is one of the most cost-effective tools available. The environmental benefits accrued from having planted trees can pay for themselves. Additional benefits not mentioned earlier include a reduced need for air conditioning (reducing the energy demand of neighboring buildings), due to the cooling effects from the trees, and a reduction in stormwater runoff.
Building the infrastructure to manage stormwater runoff can be extremely expensive. Trees reduce the maximum demand for such systems, thus reducing the overall cost of such systems.
Finally, the physical and mental health of residents is improved by having adequate tree canopy. Thus, there should be attendant reductions in cost for police protection and health care.
How can individual residents contribute to a cleaner city?
They can drive less and use public transportation. They can ask their representatives to consider the factors mentioned above when doing city planning. Citizens can ask for more trees to be planted in their neighborhoods.
If they have a good site for doing so, they can plant an appropriate tree on their own property. As an example: in Hartford, to reach their goal for tree canopy cover, the city will have to convince many property owners to allow trees to be planted on their land. There just aren’t enough city parks and right-of-way space to establish enough trees to meet the canopy goals on city property.
In what ways does a dirty city directly affect its residents?
How do you define dirty when it comes to a city? Is it merely air pollution? Do trash and general cleanliness count?
If air pollution is the sole criterion, then research has demonstrated that in cities where the concentrations of suspended particulate matter are high, in particular, PM2.5, you see a greater prevalence of respiratory illnesses. However, recent research indicates that air pollution adversely affects the development of children, including cognitive function.
What steps can cities take to achieve a cleaner environment and better air quality?
In larger cities, better mass transit systems can encourage citizens to reduce their daily driving, which reduces outdoor air pollution. However, we forget that we spend most of our time during the day indoors. Indoor air pollution is a forgotten, less publicized, problem.
Whether it is sitting in our cars during long commutes or spending 90% of our time inside our workplace and home, we are exposed to various chemicals. The more energy efficient our buildings and homes become, the more air is “trapped” indoors, increasing the concentrations of potential hazards, e.g., radon.
What lessons can we learn from some of the world’s cleanest big cities like Copenhagen and Singapore?
A collaborative effort among citizens, governance, and industries is needed to make significant improvements in the environment. All stakeholders must participate in conversations to make change happen.
How can individual residents contribute to a cleaner city?
In the United States, reducing the amount of driving that we do on a daily basis can improve outdoor air quality. Local and state governments can work together to close coal-burning power plants and incinerators in addition to halting new incinerators from being built.
But again, the effects of indoor air pollutants are significant and should not be ignored when developing strategies to improve air quality in cities.
In what ways does a dirty city directly affect its residents?
First, we must define what “dirty” really means. From my perspective, it isn’t litter, but the effect on population health and individual health that accompanies living in an urban area. There are several factors from that perspective: air quality, water quality, and noise quality. It is not an aesthetic issue; it is about hazards on so many levels that affect a population’s health.
Everyone’s health is affected by exposure to air pollution. Through our lungs, we breathe in air pollutants. From there, they enter our bodies and contribute to lung cancer and other diseases.
Contaminated water and poor sanitation are linked to the transmission of diseases such as cholera, diarrhea, dysentery, hepatitis A, typhoid, and polio. Absent, inadequate, or inappropriately managed water and sanitation services expose individuals to preventable health risks.
There are direct links between noise and health. Millions of people are affected negatively by noise pollution. Noise affects us in multiple ways: stress-related illnesses, high blood pressure, speech interference, hearing loss, sleep disruption, and lost productivity.
What steps can cities take to achieve a cleaner environment and better air quality?
I do not think a cleaner environment solely means improved air quality. This is about how to make cities cleaner altogether, in all aspects of life. We need to reduce carbon-emitting cars, trucks, and buses; traffic emits so many pollutants into the environment that impact us. We need to think about big power plants close to, or within, the cities.
Buildings in urban areas emit CO2, heat, and noise through heating systems, air-conditioning, and building services.
What we really need to look to do better is to transition from primarily carbon-based energy to green forms of energy. We need to replace dirty air-polluting power production with green energy.
Our cities need more green spaces, trees, and parks and less non-permeable surfaces like parking lots. The urban green can help by cleaning the air and producing zones of coolness in places that were once heat islands. Fresh-air corridors need to remain in place to ventilate cities with fresh air coming in from the countryside.
Cleanliness isn’t cheap. How can local governments balance their budgets while spending the necessary funds to keep their cities clean?
Regulations and some political benchmarking are needed to reduce emissions at every level. That can be done by restricting traffic in areas to reduce pollution. We can influence human behavior with financial incentives –– things like installing solar panels on homes and collecting rainwater.
On a personal level, there are many things we can do while there are also things that communities and cities can do. But it all comes down to identifying ways to change personal behavior. Driving less and using bikes, public transportation, or walking more.
Behavioral change on an urban level means looking at how and where we are building and maintaining buildings, but doing that in smarter, more responsible ways. Not everything is free, but you can make changes from one aspect to another by reducing subsidies or favoring one industry over another with environmental benefits in mind, like spending less money on streets and more on bike lanes.
What lessons can we learn from some of the world’s cleanest big cities like Copenhagen and Singapore?
When I think of cities, I do not think of their governments or their buildings, but the people living there.
People in Copenhagen, Singapore, and other clean cities around the world fully embrace the concept of carbon neutrality, green energy, public transportation, and the ability to bike and walk safely. They fully embrace giving up individual transportation in lieu of a livable city.
To make the change towards a greener, healthier, and cleaner city, good public transportation is the cornerstone. The public transportation in Copenhagen and Singapore is fantastic, which is why people use it, unlike a city like Los Angeles which barely has any public transportation.
Transforming a city into a clean and green one requires both a top-down approach and a bottom-up approach. For example, the city can turn carbon-based energy production into green, localized energy production. At the same time, we –– the citizens of cities –– can embrace carbon-neutral lifestyles.
The new clean city approach involves multiple players –– from transportation and energy to the building sector –– as well as human behavior.
How can individual residents contribute to a cleaner city?
As individuals, we need to take responsibility for our cities. It’s not only the city’s responsibility. We must collectively change the world. We need to embrace cleanliness on many levels, from the way we move to our daily habits. It’s not just littering or trash on the streets. While that may be the most visible effect, there are more severe effects tied to global warming, and that affects all living organisms on our planet.
In what ways does a dirty city directly affect its residents?
Litter has a range of impacts, including environmental, economic, health, and even crime. At Glitter we are working to remove litter from the streets in neighborhoods that often lack the resources to tackle this issue the way wealthier areas with dense commercial activity can.
In cities like Philadelphia, wealthy neighborhoods hire private cleaners to keep streets clean. Lacking the dollars and infrastructure, lower and mixed-income residential areas are neglected, leading to a disproportionate level of these negative consequences for those residents.
And I’d encourage rethinking the use of the word ‘citizens’ for two reasons: firstly, visitors (whether native or foreign-born), are going to judge a city by its level of cleanliness. Just look at Philadelphia –– we’ve sadly earned the nickname “Filthadelphia” –– and it has an impact on our image and I’m sure our tourism industry among others. The second reason is that those who live in a city but are not citizens still deserve to live in a clean and healthy environment.
What steps can cities take to achieve a cleaner environment and better air quality?
My focus with Glitter is empowering communities with an affordable and impactful street cleaning service that places a cleaner on every block. We make it affordable for neighbors to pay-what-you-can-afford to split the cost of someone coming and cleaning the block.
We had tried to integrate this into our municipal services with the City of Philadelphia’s Streets Department, getting so far as actually succeeding in a line item in the city’s budget, but the leadership changed their minds, and it’s been an uphill battle since then to collaborate.
While we continue to hope that things improve with that partnership, we are growing and cleaning every day through our crowdfunding system with neighbors and are very excited about our success and impact there.
Cleanliness isn’t cheap. How can local governments balance their budgets while spending the necessary funds to keep their cities clean?
The first thing that is needed is experienced and motivated leadership. When you have that, then everything else can work, but without it, you get programs that lack KPIs, you get budget decisions that aren’t tied to goals, and you get employees who don’t care.
We need a street cleaning program that is designed to be effective and efficient –– it requires accountability on both ends of the organizational hierarchy. Right now there isn’t any at either end. What we have are gas-guzzling machines that burn fossil fuels, break down, and don’t clean sidewalks.
We need to stop spending money on ‘campaigns’ and start spending it on infrastructure that solves issues that are unique to our neighborhoods –– like in South Philly where thousands of rowhomes have been converted into small apartments without any outdoor storage access to keep trashbags, let alone a trashcan.
What lessons can we learn from some of the world’s cleanest big cities like Copenhagen and Singapore?
I don’t know much about those cities so I can’t say what they are doing well and how that can translate –– especially without understanding the economic, structural, cultural, and political contexts of these places.
What I can say is that cities like Philadelphia, where litter is a major problem, need to spend more time understanding what isn’t working and why and then address those areas. For too long we’ve had a Streets Commissioner who has been unwilling to admit when they falter, is intimidated by innovation, and is satisfied with the status quo.
How can individual residents contribute to a cleaner city?
Glitter is designed so that any resident can take an active role in cleaning up their city, one block at a time. A resident can sign up for a crowdfunding page with Glitter, make a pledge, and then recruit other neighbors to chip in.
Our process allows for regular cleaning of city blocks that don’t have the benefit of a wealthy commercial corridor. Glitter makes a clean beautiful neighborhood accessible and equitable, especially through matching grants, corporate sponsorship, and our impact fund donations that we use to offset costs in lower income areas.
Methodology
First, we determined the factors (metrics) that are most relevant to rank the Dirtiest Cities in America. We then assigned a weight to each factor based on its importance and grouped those factors into 4 categories: Pollution, Inadequate Living Conditions, Inadequate Waste Infrastructure, and Resident Dissatisfaction. The categories, factors, and their weights are listed in the table below.
For each of the 500 biggest U.S. cities, we then gathered data on each factor from the sources listed below the table. We eliminated 197 cities lacking sufficient data in a single category, resulting in a final sample size of 303 cities.
Finally, we calculated scores (out of 100 points) for each city to determine its rank in each factor, each category, and overall. A city’s Overall Score is the average of its scores across all factors and categories. The highest Overall Score ranked “Dirtiest” (No. 1) and the lowest “Least Dirty” (No. 303).
Notes:
Data for water quality violations is from the last reported year, 2023.
The “Least Dirty” among individual factors may not be No. 303 due to ties.
Near-roadway pollution is the share of a city’s population living close to a busy road (distance within 200 meters and 25,000+ automobiles per day).
Sources: AARP, Centers for Disease Control and Prevention, County Health Rankings & Roadmaps, Environmental Protection Agency, Numbeo, other LawnStarter studies, Refuge Restrooms, SalvageParts, Texas A&M Transportation Institute, U.S. Bureau of Labor Statistics, and U.S. Census Bureau
Clean, Green Lawn Care
Why is LawnStarter ranking the dirtiest cities? How you manage your lawn care can play a big role in local air and noise pollution.
Results from a Home Gnome survey show that poor landscaping and lawn care is the No. 2 pet peeve between neighbors.
Many cities are moving toward sustainable lawn care by offering financial incentives for upgrading to electric and battery-powered equipment, implementing watering restrictions, and restricting toxic pesticides.
A clean environment can start right in your backyard:
- Switching to electric lawn care equipment can save you money over time while helping the environment.
- Clean up your yard to keep your neighbors and HOA happy (large debris can also smother your grass). Yard cleanup costs typically range from $216 and $462 for a 1/4-acre property.
- Properly maintain your grass to prevent weeds, lawn diseases, and pest infestations.
- Opt for organic pest control methods.
- Clean gutters and windows for a stunning home exterior.
- Keep your pool clean and algae free.
Not enough time in the day to pick up your yard? Hire a local LawnStarter crew to handle all your landscape maintenance, lawn care, and yard cleanup needs.
Media Resources
Quotes from LawnStarter Editor-in-Chief, Jeff Herman
- Across the cities in our ranking, an average of 13.89% of residents live near busy roads. 6 Los Angeles area cities have the highest near-roadway pollution, with 36% to 42% of residents living near high-traffic roads.
- Texas cities, Mansfield (No. 143), and Brownsville (No. 19), have the worst access to public bathrooms, followed by Palm Coast, Florida (No. 203), and Tempe, Arizona (No. 27). Out of the 50 most populated U.S. cities, El Paso, Texas (No. 42), has the worst access to public bathrooms. (Mansfield being so low on this list surprises me as it has a Buc-ee’s and a new H-E-B supermarket that just opened, so I can’t imagine the city will rank at the bottom for this metric next year.)
- Reading, Pennsylvania (No. 4), has the worst Risk-Screening Environmental Indicators (RSEI) score measuring toxic chemicals released into the environment from industrial pollution, followed by Texas cities Longview (No. 102) and Baytown (No. 17).
- According to Refuge Restrooms, Cambridge, Massachusetts (No. 226), has the best access to public bathrooms, followed by Berkeley, California (No. 238), and San Francisco (No. 89).
- High-resolution images of cities
- 2021’s Dirtiest Cities in America
- 2022’s Dirtiest Cities in America
- 2023’s Dirtiest Cities in America
- 2024’s Dirtiest Cities in America
Main Photo Credit: wachiwit / Adobe Stock / License