
There’s never been a better time to tie — or tighten — the knot. The 2022 wedding season is projected to be the biggest in 40 years.
Your chances of marital bliss, however, vary from city to city. So where should you settle down with your significant other for the best shot at a happily ever after?
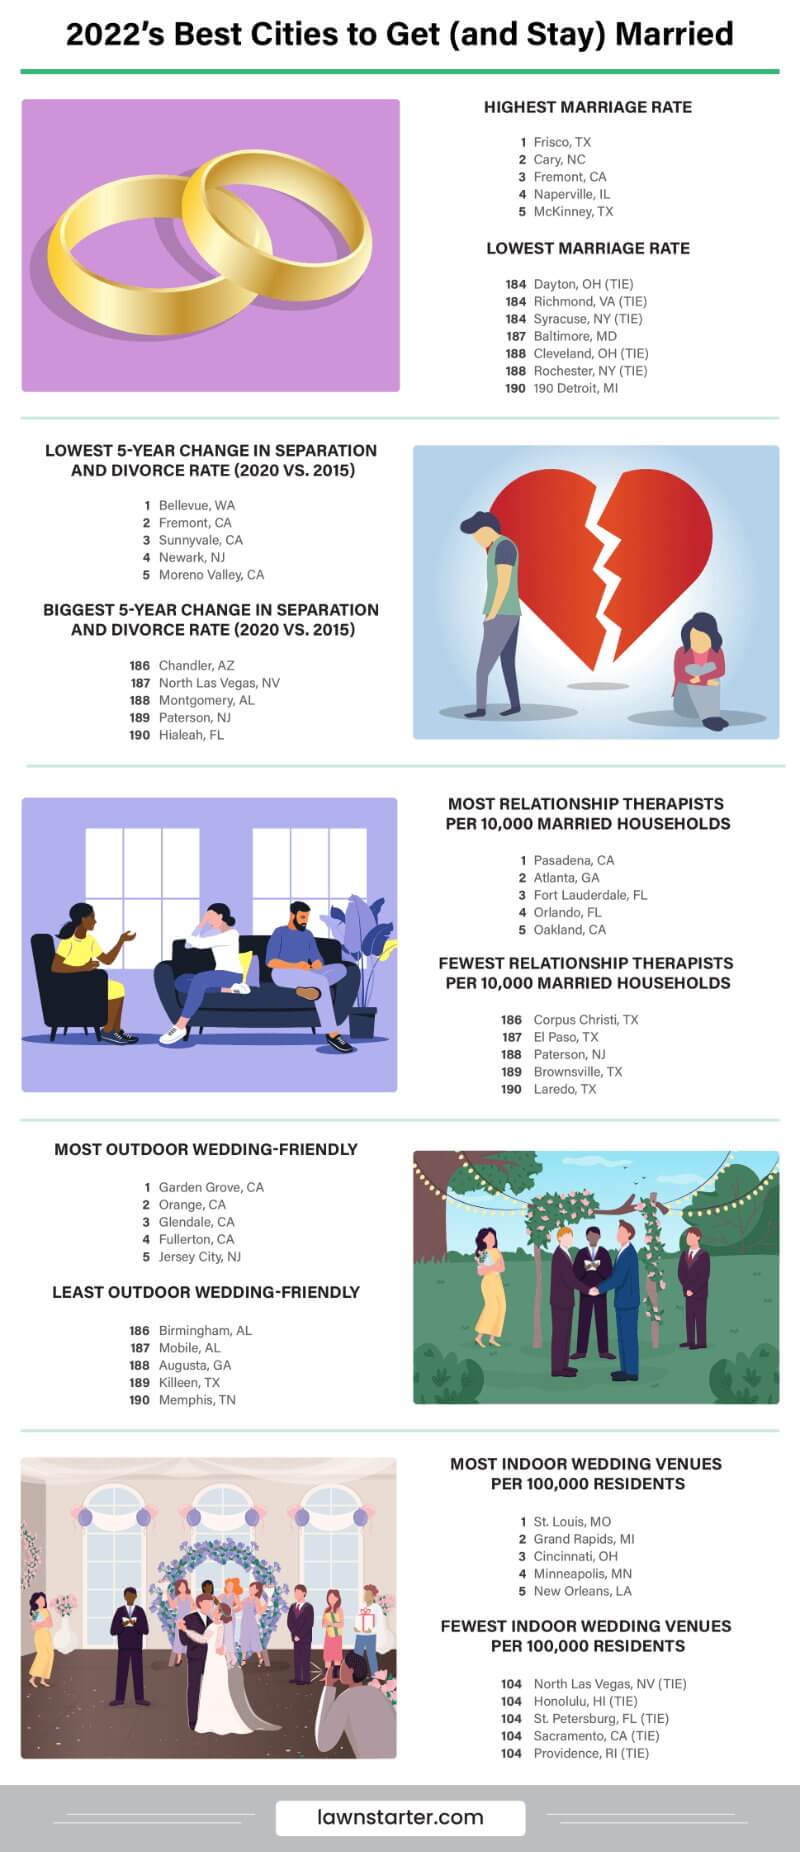
With wedding season in full swing, LawnStarter ranked 2022’s Best Cities to Get (and Stay) Married.
We compared 190 of the biggest U.S. cities across nine key indicators of nuptial success — from current marriage rates to 5-year divorce rate comparisons to wedding-venue access.
Check out our ranking below, followed by highlights, lowlights, and expert matrimonial advice.
Contents
City Rankings
See how each city fared in our ranking:
| Overall Rank (1=Best) | City | Overall Score | Marriage Stability | Marriage Potential | Marriage Intervention | Wedding-Friendliness |
|---|---|---|---|---|---|---|
| 1 | Bellevue, WA | 68.77 | 2 | 49 | 12 | 23 |
| 2 | Pasadena, CA | 65.56 | 44 | 105 | 1 | 5 |
| 3 | Fullerton, CA | 63.28 | 5 | 20 | 40 | 8 |
| 4 | Grand Rapids, MI | 62.99 | 12 | 27 | 9 | 4 |
| 5 | Orlando, FL | 59.42 | 57 | 14 | 4 | 12 |
| 6 | Newark, NJ | 59.18 | 3 | 32 | 112 | 37 |
| 7 | St. Louis, MO | 58.94 | 74 | 30 | 23 | 1 |
| 8 | Atlanta, GA | 57.42 | 78 | 73 | 2 | 47 |
| 9 | Washington, DC | 57.42 | 11 | 86 | 20 | 48 |
| 10 | Naperville, IL | 57.34 | 30 | 41 | 22 | 7 |
| 11 | San Francisco, CA | 57.00 | 35 | 47 | 15 | 14 |
| 12 | Fremont, CA | 56.92 | 1 | 95 | 183 | 135 |
| 13 | Santa Clarita, CA | 55.92 | 8 | 18 | 108 | 67 |
| 14 | Sunnyvale, CA | 55.76 | 4 | 43 | 154 | 97 |
| 15 | Irvine, CA | 55.74 | 15 | 175 | 11 | 32 |
| 16 | Rancho Cucamonga, CA | 55.56 | 24 | 2 | 73 | 49 |
| 17 | Santa Rosa, CA | 55.12 | 23 | 40 | 36 | 43 |
| 18 | Oakland, CA | 55.08 | 50 | 91 | 5 | 69 |
| 19 | Boston, MA | 54.92 | 18 | 89 | 59 | 11 |
| 20 | Glendale, CA | 54.85 | 29 | 120 | 35 | 10 |
| 21 | Miami, FL | 54.58 | 69 | 12 | 8 | 77 |
| 22 | Jersey City, NJ | 53.68 | 33 | 34 | 76 | 15 |
| 23 | Minneapolis, MN | 53.63 | 114 | 119 | 19 | 2 |
| 24 | Arlington, VA | 53.57 | 27 | 137 | 30 | 42 |
| 25 | Torrance, CA | 53.45 | 41 | 106 | 29 | 38 |
| 26 | Cincinnati, OH | 53.29 | 46 | 128 | 24 | 30 |
| 27 | Providence, RI | 53.20 | 22 | 67 | 17 | 112 |
| 28 | Olathe, KS | 53.16 | 16 | 5 | 135 | 96 |
| 29 | Chula Vista, CA | 52.83 | 6 | 182 | 158 | 25 |
| 30 | Tampa, FL | 52.77 | 99 | 11 | 18 | 16 |
| 31 | Chesapeake, VA | 52.69 | 9 | 4 | 97 | 149 |
| 32 | Overland Park, KS | 52.51 | 17 | 134 | 46 | 70 |
| 33 | San Diego, CA | 52.48 | 42 | 52 | 86 | 13 |
| 34 | Austin, TX | 51.69 | 31 | 97 | 45 | 79 |
| 35 | Plano, TX | 51.55 | 48 | 25 | 49 | 83 |
| 36 | Orange, CA | 51.48 | 94 | 8 | 53 | 20 |
| 37 | Moreno Valley, CA | 50.87 | 13 | 80 | 167 | 64 |
| 38 | McKinney, TX | 50.72 | 7 | 187 | 66 | 85 |
| 39 | Alexandria, VA | 50.55 | 106 | 145 | 16 | 6 |
| 40 | St. Paul, MN | 50.42 | 84 | 133 | 37 | 9 |
| 41 | Sacramento, CA | 49.94 | 60 | 23 | 55 | 91 |
| 42 | New York, NY | 49.73 | 38 | 50 | 133 | 65 |
| 43 | Long Beach, CA | 49.61 | 64 | 107 | 54 | 50 |
| 44 | Seattle, WA | 49.57 | 79 | 77 | 38 | 54 |
| 45 | Omaha, NE | 49.55 | 25 | 26 | 118 | 110 |
| 46 | Chicago, IL | 49.43 | 61 | 56 | 87 | 40 |
| 47 | Salt Lake City, UT | 49.30 | 68 | 125 | 14 | 109 |
| 48 | Los Angeles, CA | 49.24 | 51 | 93 | 94 | 52 |
| 49 | Fort Lauderdale, FL | 49.22 | 153 | 152 | 3 | 24 |
| 50 | Virginia Beach, VA | 48.99 | 21 | 10 | 116 | 147 |
| 51 | Amarillo, TX | 48.94 | 36 | 3 | 181 | 125 |
| 52 | San Bernardino, CA | 48.91 | 37 | 129 | 120 | 58 |
| 53 | Scottsdale, AZ | 48.87 | 65 | 141 | 39 | 75 |
| 54 | Modesto, CA | 48.69 | 49 | 6 | 149 | 118 |
| 55 | Fontana, CA | 48.63 | 28 | 114 | 179 | 59 |
| 56 | Dallas, TX | 48.57 | 47 | 53 | 77 | 102 |
| 57 | Peoria, AZ | 48.55 | 39 | 19 | 141 | 108 |
| 58 | Richmond, VA | 48.36 | 117 | 82 | 7 | 105 |
| 59 | Cary, NC | 48.35 | 43 | 171 | 43 | 101 |
| 60 | Tempe, AZ | 48.08 | 127 | 68 | 33 | 27 |
| 61 | Anaheim, CA | 48.07 | 52 | 157 | 157 | 18 |
| 62 | Philadelphia, PA | 47.97 | 80 | 39 | 92 | 55 |
| 63 | Nashville, TN | 47.96 | 54 | 36 | 84 | 107 |
| 64 | Riverside, CA | 47.72 | 53 | 139 | 89 | 66 |
| 65 | Gilbert, AZ | 47.59 | 32 | 183 | 74 | 68 |
| 66 | Honolulu, HI | 47.48 | 72 | 69 | 88 | 78 |
| 67 | Baton Rouge, LA | 47.47 | 70 | 170 | 47 | 73 |
| 68 | Pittsburgh, PA | 47.46 | 152 | 81 | 13 | 17 |
| 69 | Vancouver, WA | 47.31 | 109 | 15 | 57 | 70 |
| 70 | Garden Grove, CA | 47.30 | 67 | 117 | 177 | 18 |
| 71 | Portland, OR | 47.14 | 100 | 118 | 44 | 45 |
| 72 | Salinas, CA | 47.11 | 10 | 16 | 182 | 184 |
| 73 | Oceanside, CA | 47.10 | 86 | 64 | 109 | 36 |
| 74 | Las Vegas, NV | 46.88 | 87 | 144 | 61 | 46 |
| 75 | Ontario, CA | 46.87 | 63 | 122 | 146 | 44 |
| 76 | Buffalo, NY | 46.73 | 91 | 48 | 62 | 87 |
| 77 | Irving, TX | 46.71 | 62 | 87 | 173 | 56 |
| 78 | Palmdale, CA | 46.66 | 34 | 92 | 169 | 113 |
| 79 | Elk Grove, CA | 46.35 | 20 | 178 | 143 | 93 |
| 80 | Cape Coral, FL | 45.77 | 19 | 162 | 162 | 126 |
| 81 | Tacoma, WA | 45.62 | 96 | 24 | 31 | 144 |
| 82 | St. Petersburg, FL | 45.33 | 123 | 60 | 52 | 82 |
| 83 | Rochester, NY | 45.22 | 164 | 124 | 6 | 81 |
| 84 | Huntington Beach, CA | 45.15 | 141 | 126 | 48 | 26 |
| 85 | Henderson, NV | 45.04 | 115 | 31 | 91 | 74 |
| 86 | Corona, CA | 44.99 | 59 | 184 | 110 | 57 |
| 87 | Denver, CO | 44.98 | 147 | 160 | 27 | 31 |
| 88 | Phoenix, AZ | 44.62 | 97 | 35 | 160 | 76 |
| 89 | Springfield, MO | 44.61 | 75 | 9 | 107 | 155 |
| 90 | San Jose, CA | 44.49 | 26 | 130 | 140 | 163 |
| 91 | Lincoln, NE | 44.47 | 14 | 150 | 152 | 177 |
| 92 | Escondido, CA | 44.33 | 113 | 99 | 148 | 34 |
| 93 | Mesa, AZ | 44.30 | 89 | 135 | 144 | 60 |
| 94 | Hollywood, FL | 44.14 | 151 | 22 | 56 | 62 |
| 95 | Durham, NC | 44.13 | 71 | 165 | 42 | 150 |
| 96 | Reno, NV | 44.06 | 98 | 65 | 70 | 114 |
| 97 | Santa Ana, CA | 43.89 | 93 | 179 | 123 | 28 |
| 98 | Pomona, CA | 43.79 | 108 | 154 | 165 | 22 |
| 99 | Fort Worth, TX | 43.74 | 73 | 74 | 125 | 127 |
| 100 | Kansas City, KS | 43.71 | 112 | 94 | 171 | 39 |
| 101 | Syracuse, NY | 43.66 | 134 | 111 | 10 | 142 |
| 102 | Indianapolis, IN | 43.65 | 81 | 115 | 131 | 106 |
| 103 | Charlotte, NC | 43.42 | 105 | 101 | 60 | 119 |
| 104 | Kansas City, MO | 43.31 | 156 | 42 | 99 | 21 |
| 105 | Yonkers, NY | 43.24 | 125 | 46 | 124 | 80 |
| 106 | Hayward, CA | 43.23 | 77 | 104 | 172 | 111 |
| 107 | Colorado Springs, CO | 43.18 | 129 | 59 | 64 | 104 |
| 108 | Garland, TX | 43.06 | 58 | 79 | 176 | 137 |
| 109 | Frisco, TX | 43.04 | 40 | 190 | 26 | 98 |
| 110 | Huntsville, AL | 42.90 | 66 | 51 | 95 | 174 |
| 111 | Madison, WI | 42.65 | 90 | 164 | 85 | 114 |
| 112 | Milwaukee, WI | 42.65 | 126 | 132 | 134 | 51 |
| 113 | Pasadena, TX | 42.53 | 45 | 38 | 184 | 185 |
| 114 | Dayton, OH | 42.31 | 171 | 84 | 51 | 28 |
| 115 | Fort Collins, CO | 42.30 | 136 | 173 | 21 | 116 |
| 116 | Eugene, OR | 42.24 | 111 | 76 | 34 | 168 |
| 117 | Lakewood, CO | 42.24 | 155 | 151 | 65 | 33 |
| 118 | Chandler, AZ | 41.84 | 145 | 44 | 90 | 88 |
| 119 | Clarksville, TN | 41.77 | 124 | 7 | 155 | 130 |
| 120 | Thornton, CO | 41.64 | 118 | 71 | 153 | 100 |
| 121 | Bakersfield, CA | 41.55 | 83 | 37 | 170 | 157 |
| 122 | Shreveport, LA | 41.55 | 92 | 13 | 137 | 170 |
| 123 | Oxnard, CA | 41.43 | 76 | 188 | 129 | 61 |
| 124 | Raleigh, NC | 41.37 | 144 | 100 | 32 | 132 |
| 125 | Norfolk, VA | 41.36 | 103 | 21 | 80 | 173 |
| 126 | Savannah, GA | 41.21 | 160 | 85 | 27 | 117 |
| 127 | Louisville, KY | 40.99 | 101 | 103 | 115 | 131 |
| 128 | Lexington, KY | 40.69 | 82 | 98 | 139 | 166 |
| 129 | Midland, TX | 40.68 | 161 | 1 | 178 | 120 |
| 130 | Fresno, CA | 40.56 | 110 | 78 | 138 | 128 |
| 131 | Stockton, CA | 40.37 | 56 | 172 | 185 | 154 |
| 132 | Fort Wayne, IN | 40.31 | 121 | 29 | 159 | 133 |
| 133 | Houston, TX | 40.28 | 104 | 45 | 104 | 169 |
| 134 | Baltimore, MD | 40.20 | 162 | 149 | 50 | 84 |
| 135 | Columbus, OH | 39.97 | 149 | 90 | 150 | 72 |
| 136 | Grand Prairie, TX | 39.95 | 88 | 131 | 164 | 148 |
| 137 | Birmingham, AL | 39.94 | 163 | 88 | 25 | 134 |
| 138 | Paterson, NJ | 39.85 | 146 | 75 | 188 | 63 |
| 139 | Aurora, CO | 39.81 | 130 | 109 | 135 | 121 |
| 140 | Salem, OR | 39.78 | 120 | 28 | 101 | 167 |
| 141 | New Orleans, LA | 39.35 | 187 | 155 | 58 | 3 |
| 142 | Knoxville, TN | 39.30 | 177 | 61 | 41 | 90 |
| 143 | Joliet, IL | 39.23 | 116 | 153 | 151 | 124 |
| 144 | Lubbock, TX | 39.16 | 107 | 140 | 142 | 139 |
| 145 | Brownsville, TX | 39.00 | 85 | 70 | 189 | 171 |
| 146 | Murfreesboro, TN | 38.95 | 102 | 156 | 105 | 161 |
| 147 | Tucson, AZ | 38.92 | 168 | 54 | 103 | 89 |
| 148 | Sioux Falls, SD | 38.54 | 95 | 112 | 167 | 172 |
| 149 | Laredo, TX | 38.33 | 55 | 176 | 190 | 175 |
| 150 | Chattanooga, TN | 38.23 | 175 | 33 | 75 | 95 |
| 151 | Rockford, IL | 38.08 | 158 | 142 | 102 | 94 |
| 152 | Jackson, MS | 38.07 | 135 | 58 | 72 | 186 |
| 153 | Cleveland, OH | 37.84 | 180 | 110 | 81 | 35 |
| 154 | Mesquite, TX | 37.75 | 143 | 57 | 175 | 129 |
| 155 | Newport News, VA | 37.73 | 138 | 161 | 96 | 146 |
| 156 | Macon, GA | 37.58 | 133 | 168 | 111 | 138 |
| 157 | Arlington, TX | 37.54 | 142 | 72 | 113 | 162 |
| 158 | Columbus, GA | 37.48 | 122 | 113 | 166 | 159 |
| 159 | Winston-Salem, NC | 37.32 | 137 | 148 | 69 | 178 |
| 160 | Springfield, MA | 37.28 | 128 | 169 | 119 | 151 |
| 161 | Corpus Christi, TX | 37.10 | 132 | 121 | 186 | 145 |
| 162 | Bridgeport, CT | 36.82 | 157 | 166 | 79 | 123 |
| 163 | Aurora, IL | 36.77 | 150 | 181 | 132 | 92 |
| 164 | Memphis, TN | 36.46 | 119 | 127 | 156 | 183 |
| 165 | Tallahassee, FL | 36.37 | 148 | 136 | 67 | 175 |
| 166 | Detroit, MI | 36.08 | 170 | 55 | 98 | 142 |
| 167 | Mobile, AL | 35.93 | 131 | 138 | 121 | 188 |
| 168 | Wichita, KS | 35.04 | 165 | 123 | 114 | 141 |
| 169 | Pembroke Pines, FL | 34.63 | 154 | 189 | 93 | 99 |
| 170 | Jacksonville, FL | 34.28 | 159 | 66 | 147 | 178 |
| 171 | Tulsa, OK | 34.20 | 167 | 96 | 122 | 164 |
| 172 | Greensboro, NC | 34.00 | 173 | 143 | 68 | 153 |
| 173 | Spokane, WA | 33.60 | 183 | 63 | 63 | 152 |
| 174 | Des Moines, IA | 33.36 | 178 | 185 | 82 | 86 |
| 175 | Glendale, AZ | 33.35 | 185 | 83 | 127 | 103 |
| 176 | Akron, OH | 33.23 | 174 | 102 | 106 | 156 |
| 177 | McAllen, TX | 33.15 | 140 | 177 | 163 | 180 |
| 178 | Worcester, MA | 32.97 | 172 | 158 | 78 | 158 |
| 179 | Oklahoma City, OK | 32.81 | 169 | 163 | 117 | 165 |
| 180 | Little Rock, AR | 32.30 | 179 | 62 | 71 | 187 |
| 181 | North Las Vegas, NV | 32.20 | 184 | 180 | 180 | 41 |
| 182 | Toledo, OH | 31.65 | 181 | 116 | 126 | 140 |
| 183 | Hialeah, FL | 31.59 | 190 | 17 | 174 | 53 |
| 184 | Killeen, TX | 31.56 | 139 | 186 | 128 | 190 |
| 185 | El Paso, TX | 31.14 | 166 | 174 | 187 | 160 |
| 186 | Fayetteville, NC | 30.85 | 176 | 167 | 83 | 181 |
| 187 | San Antonio, TX | 30.77 | 182 | 159 | 145 | 136 |
| 188 | Albuquerque, NM | 29.64 | 188 | 147 | 130 | 122 |
| 189 | Augusta, GA | 27.08 | 186 | 146 | 100 | 189 |
| 190 | Montgomery, AL | 25.21 | 189 | 108 | 161 | 182 |
Highlights and Lowlights
Wedding Bells in Bellevue, Washington
This fast-growing city about 10 miles east of Seattle is our No. 1 Best City to Get (and Stay) Married in 2022, placing second overall for Marriage Stability.
Bellevue was once known as the place “where your parents lived,” but the influx of tech-savvy millennials in recent years eroded that reputation. Our data suggests, though, that Bellevue’s nuptial-friendliness is very much still alive.
When more couples were splitting up in 2020, Bellevue spouses were sticking together that year. Among the 190 cities we ranked, Bellevue registered the biggest 5-year decrease in separations and divorces, at -23%.
Perhaps Bellevue couples can thank the over 300 local relationship therapists for getting them through the roughest patches of the pandemic. Bellevue ranked 12th overall for Marriage Intervention.
Playing the Long Game in California
Want a shot at making it to your golden anniversary? Move to the Golden State. California dominates our ranking by claiming 11 spots in our top 20.
Pasadena is tops among California cities and placed first in Marriage Intervention, while Fremont proved to be the prime location for Marriage Stability (No. 1). The strong Catholic presence in Fremont might help explain its track record.
But if you’re looking for your soulmate, set your Bumble location to Rancho Cucamonga, No. 2 in Marriage Potential.
Wedded bliss is clearly the name of the game in California.
Alabama: The (Broken) Heart of Dixie
Alabama’s poor performance in our ranking underscores the irony in its nickname as the Heart of Dixie. (The moniker, of course, comes from the state’s geographical position.)
All four Alabama cities we ranked landed among our bottom 50%. In fact, Montgomery is our No. 1 Worst City to Get (and Stay) Married, owing to its position as the second worst city for Marriage Stability and ninth worst in Wedding-Friendliness. Huntsville is Alabama’s top performer at No. 110 out of 190 overall.
You’ll hear a lot of bells clanging in Alabama, but you might just be getting summoned to dinner.
Las Vegas: Great for Quick Nuptials, Average for Longevity
Las Vegas might be the most iconic — albeit ephemeral — wedding destination in America, but it’s only middling at best in our ranking at No. 74.
Why so mediocre? The city’s separation and divorce rate is one of the highest in the nation, though couples who wed in Vegas don’t necessarily stay in Vegas — and their marriages may not last, either. Remember Britney Spears’ surprise trip down the aisle in Sin City, followed by divorce 55 hours later?
But if you dream of being married by Elvis, then by all means book that $79 Southwest flight to Vegas now.
Woofing Witness in Colorado
If you’re suddenly without a witness at your nuptials in Colorado, you’re in luck: Your four-legged BFF can literally step in as your witness in the Centennial State.
One caveat: Your odds of marital success in this state are mediocre at best. Denver is our best Colorado city at No. 87. It’s ideal for a wedding ceremony (No. 31 in Wedding-Friendliness) and to save your marriage if it’s on the rocks (No. 27 in Marriage Intervention). Fort Collins has even more relationship therapists, ranking 21st in that category.
In general, Marriage Stability is the worst category for Colorado couples, so perhaps your absent, two-legged BFF just saw into the future.
Ask The Experts
Attitudes about marriage change over time. We reached out to a panel of experts to weigh in on marital trends and share their best tips for wedded bliss. See what they had to say below.
- What does marriage mean to Americans today compared with, say, 10 or 20 years ago?
- Contrary to predictions that the U.S. divorce rate would surge during the pandemic, it appears to have declined. What gives?
- Just as the U.S. divorce rate has declined over the years, so too has the marriage rate. Why are fewer people getting married?
- What are the top three advantages of marriage in the U.S. today?


What does marriage mean to Americans today compared with, say, 10 or 20 years ago?
I think it depends on your values about marriage and relationships. Of course, the marriage rate is declining for a variety of reasons, because some people have other things they may be interested in and there is less shame about living together or being in long-term committed relationships outside of marriage (note: this is quite prevalent in many European countries).
There are some consequences to such decisions (e.g., married Black couples have a very low poverty rate compared to Black single-parent families), but deciding to not marry or explore other family structures is a freedom that people can choose.
Contrary to predictions that the U.S. divorce rate would surge during the pandemic, it appears to have declined. What gives?
We would need much more research (data) to answer that question more confidently, but it may be that the pandemic was a great reminder of the need for healthy and sustainable human relationships. Marriage is one such, which requires effort and sacrifice (much like intimate friendships).
The pandemic forced couples to spend more time together. For some, that may have exacerbated problems that caused a split, but maybe for most it was a time to recommit to each other and find ways to strengthen the relationship; hence, lower divorce.
Additionally, financial constraints may have also provided more pragmatic motivations to stay together and make things work.
Just as the U.S. divorce rate has declined over the years, so too has the marriage rate. Why are fewer people getting married?
In short, see answers above. Additionally, school focus, career focus, exploration of nonsexual intimate relationships (e.g., friendships), more focus on self-actualization, reduction of social shame for not being married (e.g., old-maid trope), etc.
What are the top three advantages of marriage in the U.S. today?
There are many, but I would say:
- The chance to build a life with a partner
- Increase household income (the vast majority of marriages are two working adults), and
- If there are children involved, more adults to care for kids.
What does marriage mean to Americans today compared with, say, 10 or 20 years ago?
A lower proportion of Americans are getting married today, compared to 15 or so years ago, and a higher proportion are cohabiting. At the same time, marriage rights were extended to same-gender unions during this period.
In terms of the meaning of marriage, people today have flexibility to structure their intimate relationships in ways that fit what they would like. If some prefer cohabitation over marriage, they can form them. Likewise, if people prefer to marry, the right to marriage is now available to all.
Contrary to predictions that the U.S. divorce rate would surge during the pandemic, it appears to have declined. What gives?
I am not sure what predictions you are looking at, but the theory is that divorce rates go down during times of national stress (e.g., divorces during the Great Recession). As such, we should have expected a lower divorce rate during the pandemic, which is what happened, but now there should be a spike in 2021.
Just as the U.S. divorce rate has declined over the years, so too has the marriage rate. Why are fewer people getting married?
See my answer above regarding cohabitation.
What does marriage mean to Americans today compared with, say, 10 or 20 years ago?
I am not sure if there is a lot of conclusive research out there on this question. We do know that fewer Americans are getting married and divorced. We also know that Americans are waiting longer to get married and have kids.
In that respect, it might be that there is a subpopulation of the younger generation that looks at marriage as more of an emotional bonding than a bonding that also consolidates wealth and signifies a progression toward “baby making” years.
With that being said, social science researchers often comment on the changes in averages they find in their data and then make educated guesses about what it means for the population as a whole. That does not mean that the norm in America is now for people to not get married or have kids. It means that fewer people are deciding to get married and have kids on the schedule that their parents did.
Contrary to predictions that the U.S. divorce rate would surge during the pandemic, it appears to have declined. What gives?
That is a great question. I have not seen any conclusive data on why this is the case, but there are some theories that might give us guesses:
- Social exchange theory would suggest that people don’t leave relationships when they are miserable. They leave relationships when they are miserable and have better alternatives. If we are locked in our houses, it is hard to really find alternatives. I think an interesting follow-up question will be if we see a spike in divorces/separations once we have restrictions lifted.
- When we think about “relational value,” it is the extent to which our partners look to us as a source of comfort. Maybe because we are only spending time with our household, it is strengthening that relational value. Unfortunately, social science is not like chemistry; we rarely get a black-and-white answer. But, for me, that is what makes it fascinating.
Just as the U.S. divorce rate has declined over the years, so too has the marriage rate. Why are fewer people getting married?
There is probably a confluence of variables that impacts this trend. One thing to note is that this is a global phenomenon (per United Nations stats).
The age at which people get married has increased. Delaying marriage allows people to get more set up in their careers and become more discerning about who they marry. People will always get divorced, but financial stability and picking a partner with similar goals and beliefs will decrease the chance of divorce.
Wolfinger at the Institute of Family Studies has cited research that suggests for each year a person puts off marriage after the age of 18, there is an 11% decrease of divorce until age 32. But there is a caveat (as with most social science data): After the age of 32, there is a 5% increase in the change of divorce for each additional year a person waits.
It should be noted, the longer people put off marriage, the chance they will not get married becomes greater. That can be due to a smaller pool, less of a desire to get married (they may live with a partner, just not “tie the knot”), or they die and never have a chance to get married.
What are the top three advantages of marriage in the U.S. today?
Assuming a person marries someone they are a good match with (I would say there is little advantage in getting married to someone with whom you don’t get along), there are a lot of advantages. A noninclusive list looks like:
- Emotional connection
- Someone to raise children with (many people have children without marriage or a partner)
- Financial incentives (both pooling resources and governmental incentives)
- A person to rely on. I had knee surgery last summer, and my wife drove me to the doctor, picked up my medication, etc. If I were not married to a kind and helpful person, I would have had to find other people to help me out.
- For men in heterosexual marriages, emotional support is often provided by their wife. We find that if their wife leaves them or passes away, they are likely to experience depressive symptoms due to a lack of emotional support. Women tend to be pretty good about getting emotional support from friends and family.
There are a lot more benefits. Honestly, the top three benefits are what the person getting married values the most. It should be noted that many of these benefits can be experienced in committed relationships where people decide not to get a legal marriage.
What does marriage mean to Americans today compared with, say, 10 or 20 years ago?
Marriage is a nonstatic institution. As society evolves with time, so do its relationships, including marriage.
The meaning of marriage is changing as time continues. How Americans identify what marriage is today vs. 10 or 20 years ago would depend on the couple and their geographic locations.
One significant change occurred in 2015 when the U.S. legalized same-sex marriage with the Marriage Equality Act. This is something new that was not present 10 or 20 years ago that explains briefly how the definition of marriage can change over time.
Just as the U.S. divorce rate has declined over the years, so too has the marriage rate. Why are fewer people getting married?
According to the U.S. Census website, marriage from 2009-2019 decreased as well as divorces. In 2009, 17.6% new marriages for women ages 15 and older were reported, and in 2019 there were 16.3% of marriages reported. In 2009 there were 9.7% of divorces for women ages 15 and older, and in 2019 there were 7.6% of divorces for the same population. This information comes prior to the pandemic and could possibly be explained by many different factors.
As mentioned before, time contributes to how people view marriage. Society evolves as new technology creates new advantages and adds resources to our living standards.
Marriage traditionally was viewed as an economical advantage, depending on whom one married. However, for the last several decades, this has become less and less of a factor as women are more active in the job force, as well as earning degrees of higher education and as technology provides advantages to life that were not previously available. Access to the internet has opened more opportunities for socializing, career attainment, and educational achievement, to name a few.
Marriage traditionally was based heavily on a patriarchal advantage of giving women limited opportunities for independent success. However, in the 21st century, we see less of this as a motive for marriage. What women once had to accomplish through the success of their husbands can now be accomplished independently, therefore making marriage possibly less desirable.
This is not to say that marriage is out of favor with all genders. As marriage equality in 2015 gave the right for same-sex couples to marry, we are witnessing a new definition of what marriage means in our current century.
I believe as time continues, we will redefine the heteronormative standards of what marriage was and begin to see the institution shift to a new meaning. This among many other factors may be why we are seeing a change in numbers of both marriage and divorce.
Methodology
We ranked 190 of the largest U.S. cities from best (No. 1) to worst (No. 190) for getting and staying married based on their overall scores (out of 100 possible points), averaged across the weighted metrics below.
| Metric | Weighting | Min. Value | Max. Value | Best |
|---|---|---|---|---|
| Marriage Stability | ||||
| Marriage Rate | 2 | 23.0% | 62.6% | Max. Value |
| 5-Year Change in Marriage Rate (2020 vs. 2015) | 4 | -8.5% | 11.6% | Max. Value |
| Separation and Divorce Rate | 3 | 6.3% | 19.4% | Min. Value |
| 5-Year Difference in Separation and Divorce Rate (2020 vs. 2015) | 4 | -23.1% | 27.8% | Min. Value |
| Marriage Potential | ||||
| Never-Married Young Population Rate | 1 | 50.6% | 87.0% | Min. Value |
| 5-Year Change in Never-Married Young Population Rate (2020 vs. 2015) | 3 | -4.6% | 20.3% | Min. Value |
| Marriage Intervention | ||||
| Relationship Therapists per 10,000 Married Households | 4 | 3 | 215 | Max. Value |
| Wedding-Friendliness | ||||
| Outdoor Wedding-Friendliness | 2 | 1 | 191 | Min. Value |
| Indoor Wedding Venues per 100,000 Residents | 2 | 0 | 7 | Max. Value |
Sources: Lawn Love, Psychology Today, U.S. Bureau of Labor Statistics, U.S. Census Bureau, Yelp, and Zola
Happily Ever After
After a heartbreaking two years of delays and cancellations, the U.S. wedding industry is heading into its busiest season in 40 years.
That’s great news. U.S. couples clearly are ready to commit, but the real work begins the day after the big day.
According to researchers, marital health depends not just on a couple’s level of commitment to each other, but also on the durability of other marriages in their circle. In other words, being surrounded by successful or failed marriages can influence a couple’s own odds of marital success or risk of divorce.
So if you’re hoping for everlasting love — or feel like your marriage is on the rocks — try renewing your vows or moving to one of the Best Cities to Get (and Stay) Married.
Main Photo Credit: Shutterstock