Where can you best get around on two wheels instead of four?
To mark World Bicycle Day on June 3, LawnStarter ranked 2023’s Best Biking Cities in the U.S.
We compared the 200 biggest U.S. cities based on 27 key indicators of a cyclist-friendly lifestyle, such as access to bike trails and bike rentals, the share of bike commuters, the presence of cycling clubs, and the number of bike races and tours.
Cycle through the most bike-friendly cities in our ranking below. To learn how we ranked the cities, see our methodology.
Contents
- City Rankings + Infographic
- Top 5 Close Up
- Key Insights
- Ask the Experts
- Methodology
- Honorable Mentions
City Rankings + Infographic
See how each city fared in our ranking:
Top 5 Close Up
Check out the slideshow below for highlights and lowlights on each of our top five cities.

Access: 1
Ride Quality: 1
Safety: 27
Community: 9
Events: 12
Local tips: Get a view of the Golden Gate Bridge while cycling near cliffs overlooking the shoreline at Fort Point. Bike along JFK Promenade — a section of JFK Drive that was made permanently car-free in 2022.
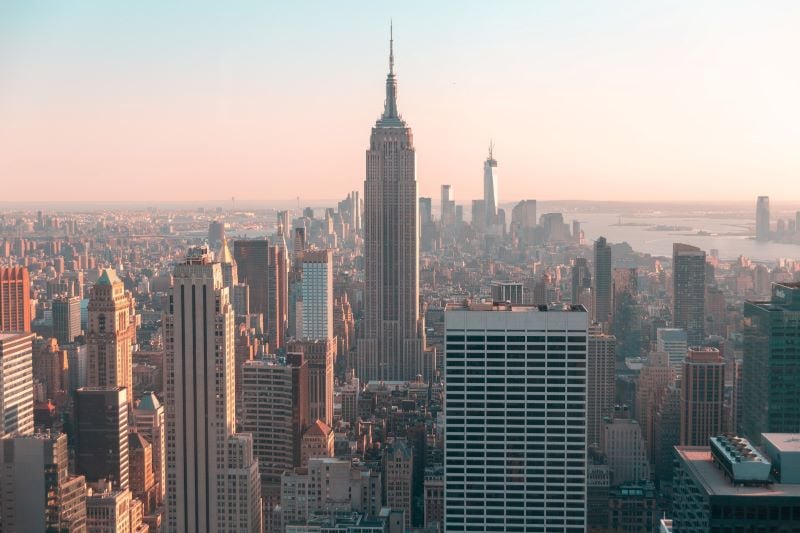
Access: 2
Ride Quality: 3
Safety: 13
Community: 1
Events: 80
Local tips: Go for a Citi Bike spin through the boroughs as the company celebrates a decade of shared trips through the city. Keep track of some NYC Streets Plan goals like new protected bike lanes, as the city invests over $900 million in transportation safety and accessibility.
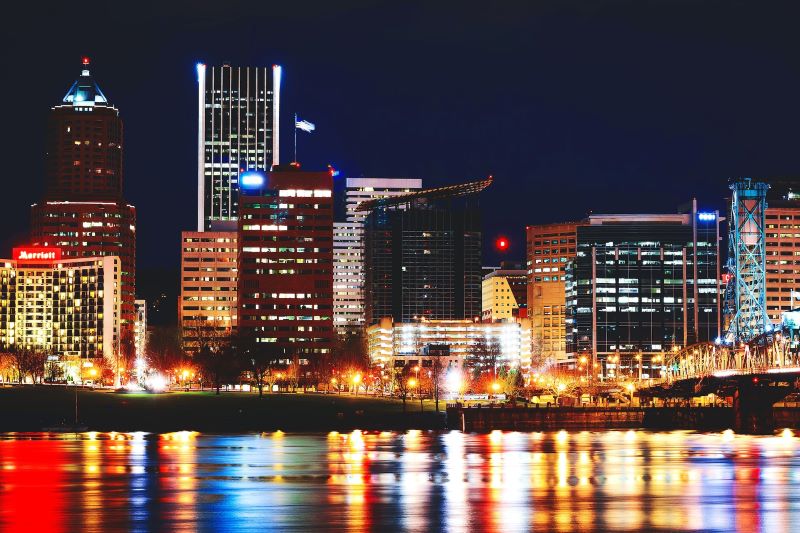
Access: 3
Ride Quality: 2
Safety: 30
Community: 5
Events: 31
Local tips: Glide through the city’s 10-mile Bike to Books Tour to admire some local bikeway art. Bike across Tilikum Crossing, a uniquely designed bridge with room for all kinds of travelers. Attend one of many events during the month-long Pedalpalooza Bike Festival.

Access: 6
Ride Quality: 4
Safety: 24
Community: 4
Events: 75
Local tips: Explore the vast web of biking routes keeping the city connected. Cycle down safe streets like the Westlake Protected Bike Lane or through natural escapes, such as the Elliott Bay Trail for some views of the bay and the Olympic Mountains.
Access: 7
Ride Quality: 16
Safety: 22
Community: 3
Events: 36
Local tips: Washington is currently expanding its National Capital Trail Network, 1,400 miles of off-street trails for cyclists and pedestrians to explore the city safely. Plan a bike tour to see some historic hotspots, or hit the city’s best trails for some fresh air.
Key Insights
The Gist
Coastal cities pedal to the top — including San Francisco (No. 1), New York (No. 2), and Portland, Oregon (No. 3) — with great access to high-quality trails and bustling biking communities. Biking continues to boom across the nation: Out of the 200 cities in our ranking, 84 offer a bike-sharing program, and 35 have a Vision Zero program protecting cyclists.
Several Southern cities swerve to the bottom of our ranking with low scores across the board — such as Killeen, Texas (No. 197), and Mobile, Alabama (No. 199), alongside Jackson, Mississippi, in last place. Aside from the sweltering climates, these cities lack access to safe and high-quality cycling infrastructure.
Standout Stats
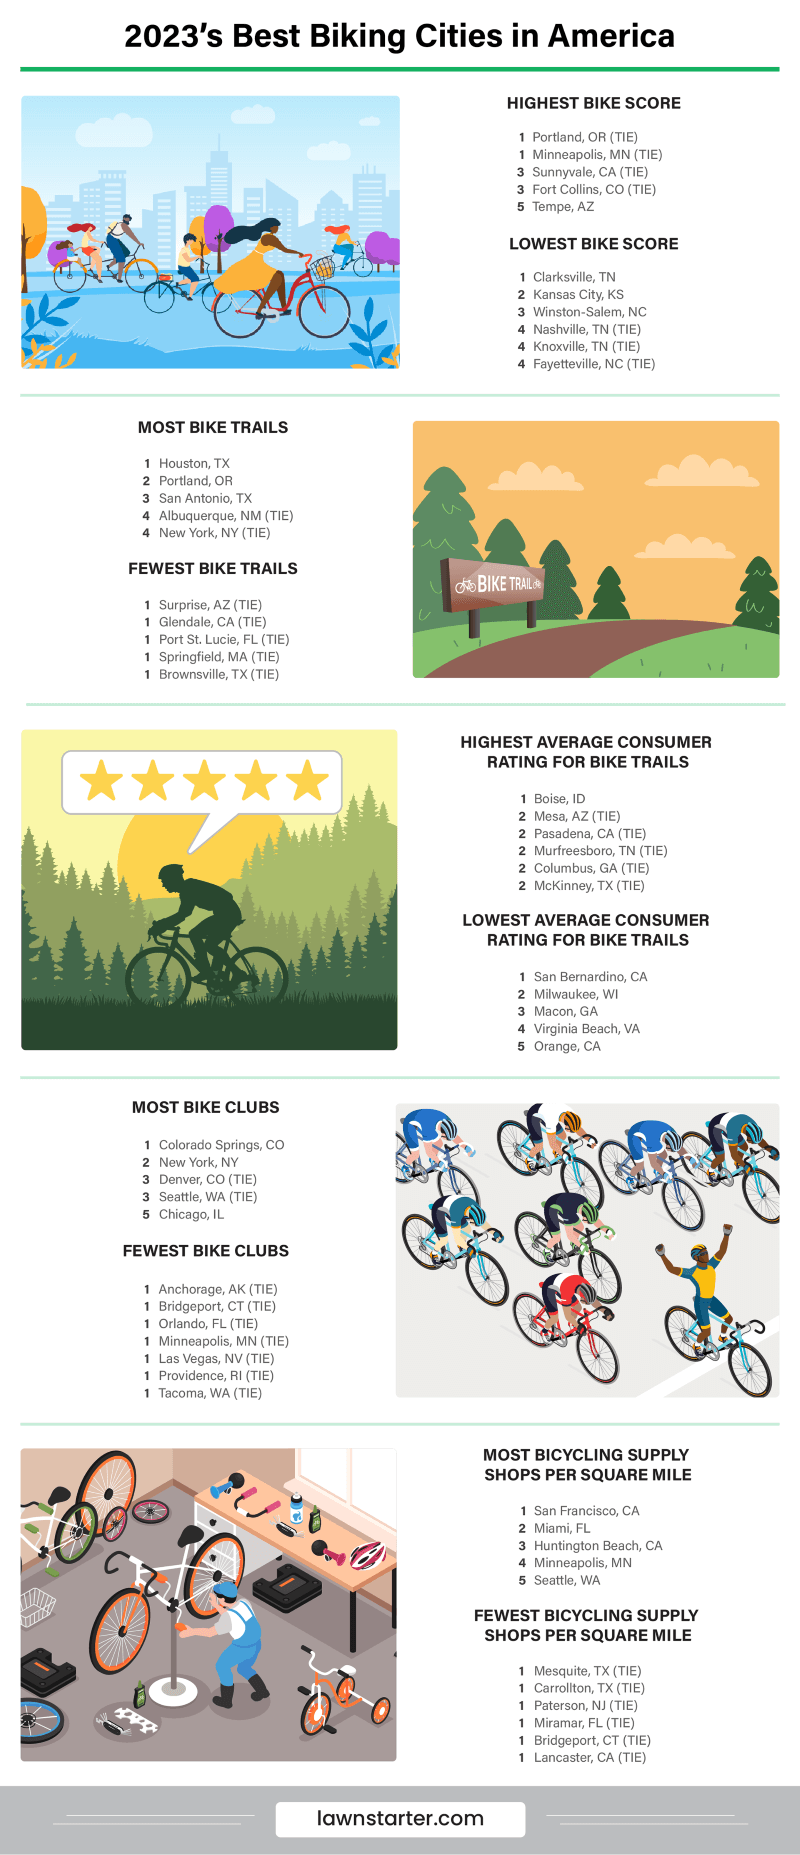
- Tour de San Francisco: Hilly San Francisco spins into first place with the top biking Access and Ride Quality. SF offers the most bike repair and supply shops, as well as the most bike rental facilities, per square mile. An ideal cycling climate, a high Bike Score, and the second-highest number of top-rated bike trails also helped The Golden City glide to the top.
- Car-Free Commutes: Northern cities like Portland, Oregon (No. 3), Minneapolis (No. 10), and Madison, Wisconsin (No. 11), cycle up impressive bike infrastructure. Minneapolis and Portland tie for the top Bike Score, while all three cities share first place for the most Bicycle Friendly America Awards. Madison and Portland also take second place in share of bike commuters, behind Fort Collins, Colorado (No. 18).
- Centennial Community: Cyclist citizens thrive in Fort Collins, Colorado (No. 18), taking second place in Community, behind New York (No. 2). Fort Collins has the second-highest number of bike-friendly businesses, behind Tampa, Florida (No. 26). Cycling companions are also abundant in Colorado Springs, Colorado (No. 34), which boasts the most bicycling clubs.
- Texas Trails: It’s easy to relax with a ride in Lone Star cities San Antonio (No. 16), Austin (No. 24), and Houston (No. 27). San Antonio has the most top-rated bike trails, thanks to more than 100 miles of multi-use trails along the city’s greenway system. Houston has the most bike trails, followed by Portland, Oregon (No. 3), and San Antonio. Austin boasts the most Bicycle Friendly America Awards out of the Texas cities.
- Spokes on Safety: Road cycling can be dangerous, leading to around 1,000 deaths and over 130,000 injuries annually. New Orleans (No. 88) skids to the bottom of the Safety rank, with one of the highest rates of both cycling-related fatalities and bike thefts. Meanwhile, Alexandria, Virginia (No. 28), boasts the highest overall Safety score, followed by Richmond, Virginia (No. 42).
- Scenic Spins: While there aren’t many bike commuters in Chattanooga, Tennessee (No. 55), the Scenic City is great for mountain biking and hosts the most cycling races and events. Propel through the picturesque Boise River Greenbelt in Boise, Idaho (No. 32), which claims the highest average consumer rating for bike trails in our ranking.
- Making the Wheels Go Round: Out of all 50 states, Massachusetts cruises ahead with the most bike-friendly legislation. From the state’s Shared Streets and Spaces Grant Program to the Complete Streets Funding Program to its Bicycle Transportation Plan, the Bay State is committed to improving bikeability.
Ask The Experts
We turned to a panel of cycling experts for biking insights and tips for first-timers. See what they had to say below.
- What are the top three benefits of cycling?
- What are your three best tips for first-time cyclists?
- What is your best piece of advice for those looking to purchase a bike for the first time?
- What are three game-changing pieces of equipment for the everyday cyclist?
- What is one way beginner cyclists can become more comfortable with commuting by bicycle?
- How can residents advocate for safer biking infrastructure in their city?


What are the top three benefits of cycling?
The top three benefits in my mind are:
- Promotion of cardiovascular fitness. Heart health can be improved with just a few minutes of cycling most days of the week. This benefit extends even into cardiac rehabilitation. Generally, it begins with stationary bikes. They provide for more control, but that activity is a healthy and safe way to train for heart health.
- Joint and tissue health. The movement of joints promotes the production of synovial fluid. This is the lubricant in your joints. Cycling provides a low or non-impact way of moving your joints against resistance. Working against resistance improves muscle, tendon, ligament, and bone strength.
- Mental wellness. Research consistently demonstrates a connection between aerobic exercise and enhanced self-esteem, improved productivity, and improvements in one’s mood. For individuals working with mental health practitioners, aerobic exercise — like biking — compliments their therapy sessions.
What are your three best tips for first-time cyclists?
- Wear proper equipment. One of my college roommates was hit by a car while riding home from work. His helmet was split in half, but it likely saved his life. However, the accident may have been avoided had he been wearing reflective clothing.
- Learn roadside maintenance and keep a spare tube with you. When I first started riding, I found myself with a flat and a long walk home.
- Be defensive. Do not count on motorists to see you, or even be looking for you. It is critically important for you to pay attention to your surroundings and the environment.
What is your best piece of advice for those looking to purchase a bike for the first time?
- Get your bike professionally fit to you. Ensuring your bike fits you properly can alleviate a lot of pain — literally.
What are three game-changing pieces of equipment for the everyday cyclist?
- Mudguards or fenders can each be a huge help, especially if you live in wet or rainy areas.
- Bike lights (head and tail) are great for your own visibility and for making you more visible [to drivers].
- Padded shorts.
What is one way beginner cyclists can become more comfortable with commuting by bicycle?
I don’t know that I can limit to just one suggestion, but how about two that are linked:
1. Choose your route carefully. Your preferred or usual way in a car may not be the best way on a bike. Some roads are less direct, but much more cyclist friendly (e.g., wider roads, more room, flatter).
2. Give yourself more time than you expect you need when you start. Try it out on a day when you are not on a time crunch, and don’t forget you need to make it back home.
How can residents advocate for safer biking infrastructure in their city?
1. Notice signage, roadway, and access issues. Then, be engaged at the city council meetings.
2. Being a part of a group can be a lot of fun, while also giving a bigger voice for advocation.
What are the top three benefits of cycling?
In my opinion there are more than only three top benefits of cycling; below are the benefits that would likely be on my top 3 list of the most important ones:
- You can improve your cardiorespiratory fitness. Improvements in cardiorespiratory fitness has been associated with better overall health while helping prevent the development of chronic conditions such as cardiovascular disease, cancer, diabetes, etc.;
- It is an activity that provides a sense of freedom, which can help improve mood and overall happiness. Cycling, like the majority of other forms of exercises, can also help alleviate the feelings of anxiety, depression and stress;
- Cycling is a non-weight bearing activity that provides a low impact option minimizing the stress of joints while still promoting excellent skeletal muscular fitness;
What are your three best tips for first-time cyclists?
- Make sure you choose the appropriate bicycle for the purpose of your riding needs (Consult with a local bike shop for the best equipment for your needs); In general, a bicycle that is comfortable with a great saddle (a saddle that provides extra cushioning and support) and of good quality so you can have a reliable and comfortable equipment that you can enjoy for a many years;
- Appropriate cycling clothes; clothes that are comfortable and also bright colored with reflective materials so drivers can see you easily along with shoes that allow for the rider to ride comfortably but also efficiently;
- Purchase of a good quality helmet (nowadays they even have helmets with airbags!); safety while riding is a critical factor and a good quality helmet that is also comfortable is a must have for riders wanting to experience the best of cycling.
What is your best piece of advice for those looking to purchase a bike for the first time?
My best advice is to visit a local bike shop and consult with a bicycle specialist on the latest and greatest bicycles that would be the best fit for your needs. At the bike shop, the specialist can provide advice not only on the most appropriate equipment for your needs but can also fit you (i.e. size wise) on a bike so you will have the most comfortable and efficient ride possible. With a great bike, your first cycling experience will most certainly be enjoyable and perhaps life-changing.
What are three game-changing pieces of equipment for the everyday cyclist?
1. For safety, a great rear flashing light; This way you can be seen easily while riding in traffic; Also a bright front light so you can also be seen easily by pedestrians or drivers while providing you with great vision if you ever end up having to ride in the dark/evening;
2. A spare inner tube and flats tool kit with a mini-pump; this way if you ever end up having a flat tire while riding you can easily fix it and continue to your destination;
3. Cycling computers; a good cycling computer can provide you with GPS, guiding you to your destination and tracking milage, cadence, etc along the way.
What is one way beginner cyclists can become more comfortable with commuting by bicycle?
Pair up with friends that have experience commuting daily so they can teach the beginner rider the ins and out of riding sharing the road with vehicles but also learn the best and safest routes to ride on a daily basis. Additionally, riding around in a safe place (like their neighborhood or a local park) will allow them to get a good feel for the bike.
How can residents advocate for safer biking infrastructure in their city?
Cyclists need to advocate for safer biking infrastructure with their city leaders; Cyclists should always advocate for more bike lanes in their cities, remodeling/maintenance of side-walks, while also helping promote education for drivers on how to keep cyclists safe while sharing the roads. Residents can also ask for support from local bicycle shop for the development of educational materials to be distributed at local Department of Motor Vehicles (DMVs); education materials designed to educate car drivers on how to protect cyclists that need to ride on the roads.
1. What are the top three benefits of cycling?
- Cycling is a great form of exercise because it improves the cardiorespiratory system, which is important because heart disease is the No. 1 cause of death in the U.S.
- If cycling is done on hilly terrains, there is even greater stress to the muscular system than on flatter terrains, which is important for maintaining strength.
- Cycling is also an excellent choice for individuals who need to do low-impact exercise due to joint problems, such as arthritis.
2. What are your three best tips for first-time cyclists?
My best advice about cycling is to first find a bike that fits your body and the type of surfaces you will most likely be riding on. Bicycles vary greatly with the construction of the frame, the type of tires, and the components (gears, brakes, etc).
While your local bicycle shop is your best resource, there are articles online about how to get a general idea of what frame size you need and how to choose the type of bike that will be best for your riding conditions.
Second, find people to ride with. It is not only safer, but you also can learn about cycling a lot faster, including basic bicycle maintenance. Many bicycle shops have group rides for people of varying abilities.
Third, invest in proper cycling shorts. You will be a lot more comfortable and enjoy your rides much more.
1. What are the top three benefits of cycling?
- Cycling is a great way to increase your physical activity, which has numerous physical and mental health benefits.
- Cycling is a low-impact exercise. It is a great option for health benefits while reducing impact-related stress on knees, ankles, hips, and lower back.
- Cycling is the most efficient form of locomotion, meaning that it requires less energy per kilometer than any other type of human-powered movement. This can expand your “playground” to allow you to explore a much greater area. While it may take five to seven hours to cover 20 miles while hiking, you can cover that same distance on a bicycle in one to two hours.
2. What are your three best tips for first-time cyclists?
- Invest in a good pair of cycling shorts and a new helmet. Cycling shorts with padding will help reduce some of the soreness that will inevitably occur after you spend an extended amount of time on your new bicycle saddle. Don’t worry if the skin-tight lycra look isn’t for you — there are lots of options of shorts with a padded liner that look like “regular” shorts. The helmet doesn’t need to be expensive, but it needs to have a Consumer Products Safety Committee (CPSC) sticker. Purchasing a new helmet will ensure that the protective components have not been damaged due to a previous accident or from an accidental drop.
- Learn how to change a bicycle tire. A flat tire 10 miles from home can turn a morning bike ride into a long walk home. Check with your local bike shop or sporting goods store to see if they offer classes on basic bicycle maintenance.
- Keep it fun! Incorporate cycling into family activities, visit a new park or trail, or ask a friend to join you on a bike ride. We are less likely to continue an activity if we do not enjoy it. If it starts to become a chore, slow down or shorten the ride. You will still get many health benefits with a 10- to 20-minute bike ride.
Methodology
First, we determined the factors (metrics) that are most relevant to rank the Best Biking Cities in the U.S. We then assigned a weight to each factor based on its importance and grouped those factors into six categories: Access, Ride Quality, Safety, Climate, Community, and Events. The categories, factors, and their weights are listed in the table below.
For each of the 200 biggest U.S. cities, we then gathered data on each factor from the sources listed below the table.
Finally, we calculated scores (out of 100 points) for each city to determine its rank in each factor, each category, and overall. A city’s Overall Score is the average of its scores across all factors and categories. The highest Overall Score ranked “Best” (No. 1) and the lowest “Worst” (No. 200). Note: The “Worst” among individual factors may not be No. 200 due to ties.
Sources: AllTrails, Bikeshare.com, Bike Index, The League of American Bicyclists, Meetup, National Center for Disaster Preparedness, National Centers for Environmental Information, National Highway Traffic Safety Administration, TRIP, U.S. Census Bureau, U.S. Environmental Protection Agency, USA Cycling, Vision Zero Network, Walk Score, World Naked Bike Ride, and Yelp
Honorable Mentions
Biking is good for your health, the environment, and your wallet. Unfortunately, it’s not safe or easy to do in car-dependent cities.
Thankfully, from car-free streets to prioritizing bike networks, cities across the nation are starting to invest more in bike-friendly infrastructure.
Learn about more beloved biking destinations below, including some cities that were too small to be included in our ranking.
- Atlanta (No. 21) has transformed 22 miles of railroad tracks into the BeltLine, a trail system circling through the city. Catch the public art installations as you cruise through, or take a guided bike tour.
- Make sure to put on your helmet before hitting the trails in Bentonville, Arkansas, aka the Mountain Biking Capital of the World. The city offers over 28 miles of fun mountain biking options for both beginners and experienced riders.
- Chicago (No. 8) is in the process of creating a 500-mile bike network connecting the city, with an emphasis on safer options like protected bike lanes and off-street trails.
- Since creating the nation’s first bike lane in 1967, Davis, California, has kept up the momentum to call itself the Bicycle Capital of America. Take a historic bike tour through the city before checking out the U.S. Bicycling Hall of Fame and Museum.
This World Bicycle Day, hire a local LawnStarter pro to take care of your yard chores so you can enjoy two-wheeling in the great outdoors.
Media Resources
- High-resolution image of infographic
- High-resolution images of cities
- 2022’s Best Biking Cities ranking results
- 2021’s Best Biking Cities ranking results
Main Photo Credit: Shutterstock