
Which cities are best for running a short-term rental property on sites like Airbnb and Vrbo?
LawnStarter ranked 2023’s Best Cities to Own a Vacation Rental, with major changes in this year’s ranking due to the widespread “Airbnbust.”
Hint: College towns and smaller cities are your best bets now. Big cities dropped in our rankings this year.
We compared over 180 of the biggest U.S. cities based on six categories. We considered legal restrictions on short-term rentals, occupancy rates, and revenue potential. We also looked at operating expenses like housekeeping services and utilities, among 18 total metrics.
Find the best spot for your future BnB in our ranking below. To learn how we ranked the cities, see our methodology.
Contents
- City Rankings + Infographic
- Top 5 Close Up
- Key Insights
- Regional Snapshots
- Ask the Experts
- Methodology
- Final Thoughts: Airbnbust Breakdown
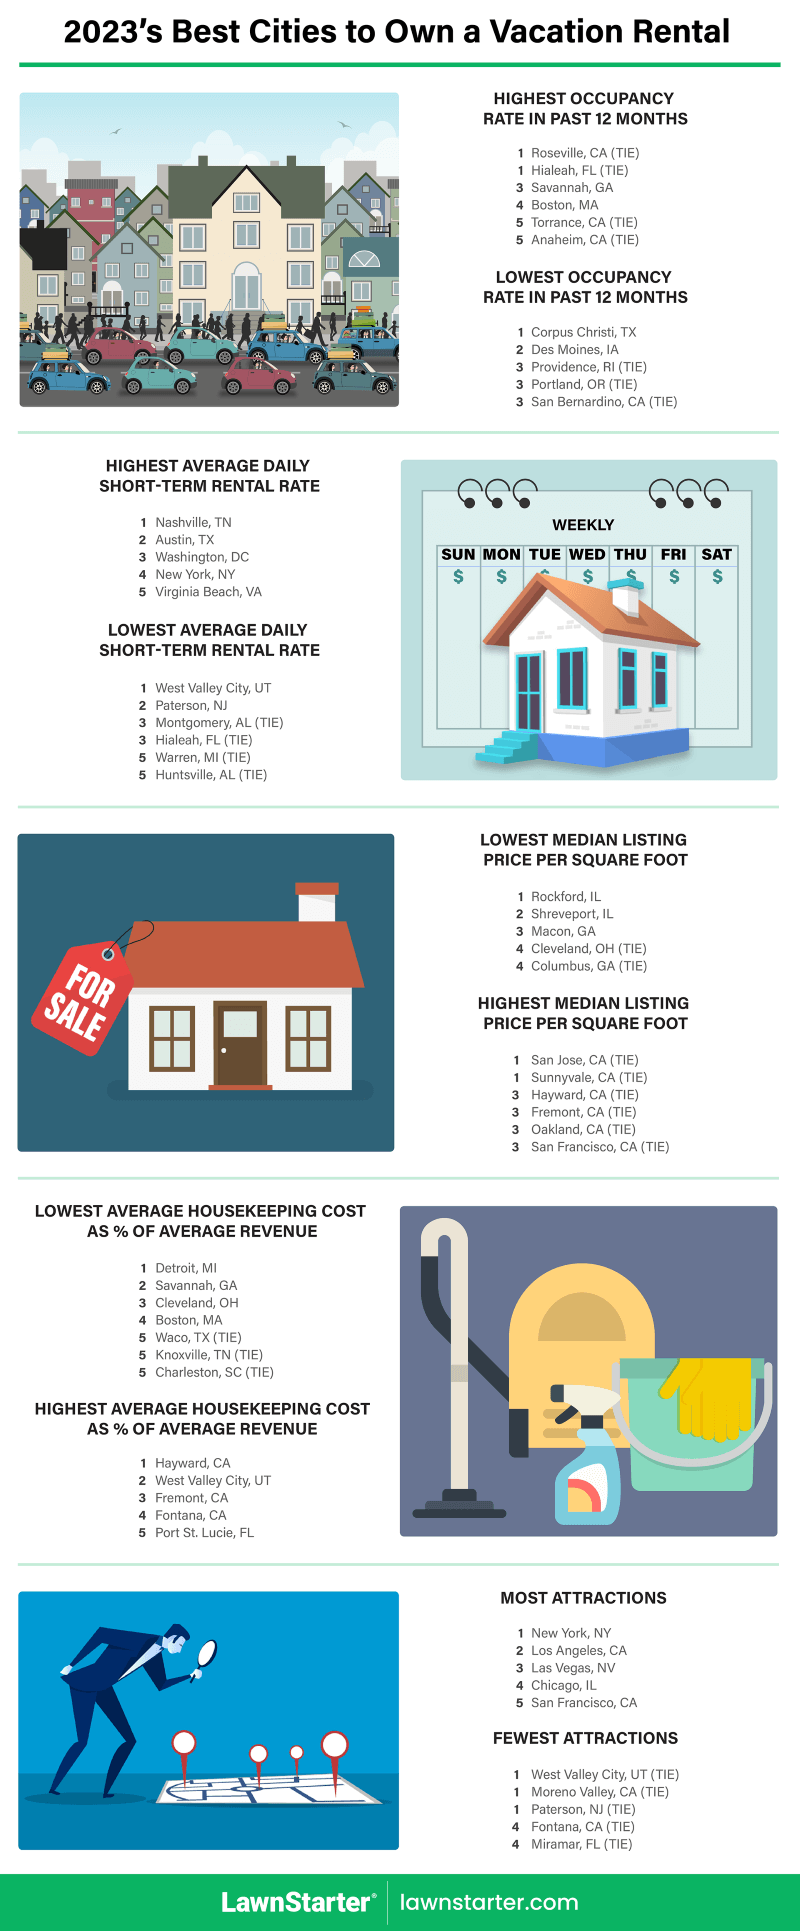
City Rankings + Infographic
See how each city fared in our ranking:
Top 5 Close Up
Check out the slideshow below for highlights on each of our top five cities.

Occupancy Rate in Past 12 Months: 51% (Rank: 50)
Average Daily Short-Term Rental Rate in Past 12 Months: $156 (Rank: 51)
Average Revenue in Past 12 Months: $29,223 (Rank: 21)
Average Cost of Housekeeping Services (as % of Average Revenue): 0.53% (Rank: 28)
Average Cost of Lawn and Garden Services (as % of Average Revenue): 1.39% (Rank: 23)
Photo Credit: Chuck Givens / Unsplash / Unsplash License

Occupancy Rate in Past 12 Months: 45% (Rank: 65)
Average Revenue in Past 12 Months: $20,761 (Rank: 61)
Median Listing Price per Square Foot: $159 (Rank: 21)
Median Annual Property Tax: 0.65% (Rank: 39)
Average Cost of Home Improvements (as % of Average Revenue): 9.32% (Rank: 20)
Photo Credit: Zach Farmer / Unsplash / Unsplash License

Occupancy Rate in Past 12 Months: 52% (Rank: 44)
Average Revenue in Past 12 Months: $24,400 (Rank: 48)
Median Listing Price per Square Foot: $200 (Rank: 59)
Average Cost of Housekeeping Services (as % of Average Revenue): 0.41% (Rank: 8)
Number of Attractions: 451 (Rank: 43)
Photo Credit: Pixabay / Pexels / CC0

Median Listing Price per Square Foot: $139 (Rank: 8)
Median Annual Property Tax: 0.51% (Rank: 18)
Cost of Living Index: 88 (Rank: 23)
Average Cost of Housekeeping Services (as % of Average Revenue): 0.61% (Rank: 41)
Average Cost of Utilities, Fuel, and Public Services (as % of Average Revenue): 18.95% (Rank: 43)
Photo Credit: WeaponizingArchitecture / Wikimedia Commons / CC BY-SA 4.0

Occupancy Rate in Past 12 Months: 46% (Rank: 64)
Average Daily Short-Term Rental Rate in Past 12 Months: $171 (Rank: 38)
Average Revenue in Past 12 Months: $29,050 (Rank: 23)
Average Cost of Utilities, Fuel, and Public Services (as % of Average Revenue): 19.38% (Rank: 46)
Number of Attractions: 486 (Rank: 37)
Photo Credit: Will Buckner / Wikimedia Commons / CC BY 2.0
Key Insights
The Gist
College towns offer a unique advantage to running a short-term rental (STR) — a consistent market of families needing flexible options when visiting (and celebrating) their favorite scholar. Cities like Durham, North Carolina (No. 1), Milwaukee (No. 3), and Mobile, Alabama (No. 4), finished at the top with high occupancy rates and high revenue potential, as well as the fewest legal restrictions.
A total of 30 California cities landed in the bottom half of our ranking — including Los Angeles (No. 173), San Francisco (No. 178), and Huntington Beach in last place — mainly due to high Initial Investment and Operating Expenses, on top of stern legal restrictions. With housing shortages impacting local residents, many Golden State cities have cracked down on STR legality to encourage long-term leases and local homeownership. The state government is also considering taxing STRs.
Across all 182 big cities in our ranking, the average STR occupancy rate was 42%, and the average annual revenue over the past 12 months was $18,691.
Standout Stats
Top 10 Takedown
- This year, we added a Legality category, reducing scores for cities with legal restrictions like permit requirements, rental-period and guest limitations, and rules on property type. This caused several of 2022’s top 10 cities to tumble in this year’s ranking, including New York (No. 118), New Orleans (No. 160), and Las Vegas (No. 67). Last year’s top city, Miami, dropped to No. 27 due to permit requirements and reduced Revenue Potential.
Exotic Escapes
- Despite the distance, short-term getaways are lucrative in Anchorage, Alaska (No. 5), which raked in an average of $29,050 over the past year — the 23rd-highest revenue out of the cities in our ranking. On average, Anchorage BnBs bring in more income than those in larger tourist destinations like New Orleans (No. 160) and Chicago (No. 101). While the state is considering some constraints due to local housing shortages, there currently are no such restrictions impacting Anchorage.
Firm But Fruitful
- Boston (No. 125) boasts the highest Revenue Potential from STRs, bringing in an average of $61,445 over the past year. That’s over $2,000 higher than the average national salary and nearly $13,000 ahead of Charleston, South Carolina (No. 48), which claimed the 2nd-highest average revenue, $48,713. Both Boston and Charleston enforce red tape on STRs. However, South Carolina is considering a bill that would prohibit local governments from regulating the STR market.
Order and Inflation
- Despite strict regulations and low occupancy rates, hosts can rake in the dough in Los Angeles (No. 173). LA has busted thousands of illegally operating STRs, and active hosts are taking advantage by hiking up rates. The City of Angels had the 11th-highest average daily rate over the past year at $216.
Rental Restrictions
- Cities big and small are attempting to rein in short-term rentals. 11 cities — including Boston (No. 125), New York (No. 118), and less populated Sunnyvale, California (No. 181), and Springfield, Massachusetts (No. 177) — tied at the bottom of the Legality category. These cities have implemented policies requiring permits, limiting the rental period and number of guests, and preventing STRs on non-owner occupied property. 31 cities tied at the top with no legal barriers.
New York Nightmare
- Until early September 2023, New York (No. 118) was an Airbnb empire, claiming the 3rd-highest average annual revenue over the past year — $46,406 — and the most attractions to draw in guests. However, a recent clampdown has caused the removal of nearly 15,000 local listings from Airbnb between August and September 2023. With fewer restrictions, Yonkers, New York (No. 53), and New Jersey cities Paterson (No. 75) and Jersey City (No. 97) might be easier options for running an STR in the NYC metro area.
Risky Results
- Vacation rentals in Nashville, Tennessee (No. 68), lead with the highest average daily rate, $260, followed by Austin (No. 77) and Washington (No. 163). However, all three cities struggle with costly Initial Investments, legal limitations, and occupancy rates below 42%, the average across the cities we ranked. The occupancy rate for STRs in Austin over the past year was only 28%. There are about 2.5 Airbnb properties for every housing unit for sale in Travis County, and the oversaturation of STRs may be driving the local Airbnb market crash.
Safer Stakes in the Suburbs
- Hialeah, Florida (No. 84), and Roseville, California (No. 104), tied for the highest occupancy rate, 79%, over the past 12 months. However, hosts in these cities charged lower daily rates on average, likely due to lack of Entertainment Options. Corpus Christi, Texas (No. 169), had the lowest occupancy rate in our ranking at 10%.
Regional Snapshots
Rust Belt Investments
- Some Rust Belt cities in New York and Ohio stand out at the top of our ranking with high revenue over the past year and low Initial Investment costs. Hosts also benefit from low cost of living and Operating Expenses. Cleveland (No. 11) has the 4th-best median listing price, and Syracuse (No. 12) and Rochester (No. 8) follow closely behind. Buffalo (No. 23), Cleveland, and Cincinnati (No. 15) also offer a high number of attractions.
Carolina Cabins
- North Carolina cities Durham (No. 1), Winston-Salem (No. 6), and Charlotte (No. 10) finished in the top 10, with low Operating Expenses and high Revenue Potential. The state is considering a bill that would prevent cities from enforcing legal restrictions on STRs. If successful, the remaining Tar Heel cities — Raleigh (No. 52), Fayetteville (No. 63), and Greensboro (No. 110) — are likely to move up in future editions of our ranking.
Texas Expenses
- A bill is in the works to study the impact of local regulations on STRs in Texas. A federal court recently struck down the STR ordinance in Austin (No. 77), now allowing rentals on non-owner-occupied property, but hosts still need a license. Dallas (No. 102), however, recently banned vacation rentals in single-family neighborhoods, eliminating 95% of the city’s STRs. While Houston (No. 25) is considering introducing constraints, none impeded hosts at the time of writing.
Blazing Accommodations
- Initial Investment costs are high in the Phoenix (No. 14) metro. Despite that, Phoenix had the highest STR growth in 2023 and landed near the top of our ranking — alongside two of its suburbs, Mesa (No. 9) and Tempe (No. 13) — with high Revenue Potential and low Operating Expenses. Meanwhile, Scottsdale (No. 151), Peoria (No. 129), and Glendale (No. 124) fell in the ranks due to low Revenue Potential.
Affordable Alabama Avenues
- Birmingham (No. 2) and Mobile (No. 4) soared to the top with high Revenue Potential and low Initial Investment costs and Operating Expenses. While Montgomery (No. 74) also requires low Initial Investment, it also has high Operating Expenses and the lowest Revenue Potential among the four Alabama cities in our ranking. Huntsville (No. 98) is currently the only one out of the four with STR restrictions.
Ask The Experts
Establishing a vacation rental can be challenging, especially in a growing (and oversaturated) market. We reached out to a panel of experts for tips on setting yourself apart from the competition. Read their insights below.
- What’s the outlook of the vacation rental industry for the next 1–3 years? What about long-term?
- In a market that’s saturated with vacation rentals, how can an owner make theirs stand out from the competition?
- What are your top three tips for people looking to invest in a vacation rental?


What’s the outlook of the vacation rental industry for the next 1–3 years? What about the long term?
Destinations are becoming more aware that more accommodations, and thus more visitors, are not necessarily a good thing. Destinations such as Virginia Beach, Myrtle Beach, and Panama City Beach that didn’t figure this out until it was too late are regretting their development decisions.
So, My prediction is that destinations like Outer Banks, NC and Boulder, CO will steadily grow, but with limits set and moratoriums on new construction. The growth of new properties will be in new destinations, but also in VRBO and Airbnb to take advantage of existing opportunities without creating new accommodations.
In a market that’s saturated with vacation rentals, how can an owner make theirs stand out from the competition?
Destination marketing gets the eyeballs to a website for booking, but visitors are looking for both value and convenience to make their choice. P1p fills one of the convenience gaps.
Vacation renters don’t want to spend their afternoons stocking the fridge with fresh necessities from the crowded Walmart. They also want to be responsible and purchase local produce, which is farm fresh. Other such conveniences, coupled with the booking, could tip the balance.
What are your top three tips for people looking to invest in a vacation rental?
Location, location, location.
- First, the investment needs to fit a personal lifestyle rather than cash flow. So, pick a location that is attractive for the investor (activities, landscape, close to family).
- A location that isn’t saturated with VR. Values will appreciate, but where demand is high in saturated locations, older properties will be replaced with newer and higher-priced development. Eventually, investments will become replaced at a depreciated value.
- Finally, the location should have the destination stewardship mentality, which is that a destination should be a wonderful place to live with a sustainable plan to manage the vacation economy. More than one-third of the economy is dependent upon tourism, and the residents become resentful.
Some cities and states impose strict regulations on short-term rentals. How can hosts ensure they’re following all applicable local and state regulations before advertising their space?
There are two obvious sources of this information. The first is the online marketing platform(s) they intend to use to advertise their property. In recent years, destinations have sued these online platforms for not collecting the required occupancy taxes, and the destinations have won.
These lawsuits have put the marketing and sales platforms on notice that they need to pay attention to local and state regulations. A homeowner can read the conditions for listing a short-term rental, which most likely will include regulations that must be followed.
Second, there is usually someone within the local government who handles the dissemination of local and state regulations and restrictions on short-term rentals. A homeowner who is considering a short-term rental offering should do their research, find this person or government division, and get to know the ins and outs of the regulations. Many of these regulations are in place to protect the homeowner.
What hidden costs, if any, should short-term rental owners watch out for?
There are many costs to a short-term rental that are not hidden but just left out of the cash flow equation. The cost of a rental turnover is a recurring expense that homeowners will incorporate into each rental.
However, an owner must also consider maintenance, repairs, and wear and tear on the property over a longer period. It is good to have a depreciation schedule for all these assets separately –– the property, appliances, furnishings, etc. –– so that the life of the assets can be included in a rental pricing structure. Each rental should be paying the fair share of the costs the property owner must bear.
What are the top three amenities that will attract the most guests?
Beyond providing a clean and safe accommodation experience, a homeowner should consider the following.
- The top asset would be a surprisingly amazing view. These are difficult to come by and so are highly valued. A homeowner must be extremely aware, however, of the community and what effects the location of the great view has on the off-property views.
In North Carolina, the Ridge Law restricts structures to be no higher than the tree line due to the Sugarloaf condominiums in Western NC. Great views can create unsightly intrusions from offsite locations.
- The second would be unique and creative activities and experiences available within a reasonable radius of the property. After all, the destination location is a strong reason that motivates visitation. These “attractions” would not include go-cart tracks, hyped tourist gift shopping, etc.; instead, they would be local experiences that are unique to the destination.
- Finally, a variety of local food experiences. Are there options to provide vacationers with local farm products? Can visitors schedule farm visits and experience pick-your-own options for produce needed for their stay? Are there award-winning chefs in the destination?
What’s the outlook of the vacation rental industry for the next 1–3 years? What about the long term?
The past year showcased an explosion in the vacation rental demand, with increased pricing to match. The short-term and long-term trajectory remains the same, where demand will exceed supply in hotspot areas during the high season.
With the average daily rate (ADR) for vacation rentals climbing, hotel chains and property management companies have stepped into the mix by expanding their portfolios to include private home vacation rentals.
In a market that’s saturated with vacation rentals, how can an owner make theirs stand out from the competition?
The saturation level varies geographically, seasonally, and psychologically. Motivated travelers will optimize their searches by working a year or more in advance of the travel dates.
The budget-conscious tourist may wait until the last minute to catch a deal but will need to be flexible. Vacation rental owners can stand out through staging, competitive pricing, and service, all of which should have the end goal of getting outstanding reviews of the property.
First, when creating a listing profile for potential guests, owners should stage the property as if they were going to sell it. The images should convey that the property is immaculate, homey, and move-in ready.
Modest investments in décor, such as modern comforters with pintuck pleats or jacquard stripes, will photograph beautifully and give an upscale appearance. Fresh paint in a soothing tone is a must, and one or two large pieces of art, such as wrapped canvases of photographed local sites, will offer focal points.
Ditch the knickknacks and strive for an open, fresh appearance. Importantly, do not mislead. A sure way to get a poor review is to showcase a beautifully appointed home that has, in actuality, suffered from overuse.
Second, price the rental competitively. When preparing to list, look at similar properties, compare the amenities, and list slightly under those with more reviews. Be transparent about what is and is not included in the rental cost.
If amenities such as linen service and parking are included, be certain to detail these benefits. If there are restrictions, such as a single parking pass included with the rental, make sure that any restrictions or extra fees are clearly stated. Renters do not want to be surprised by hidden charges and inconveniences at the last minute.
Third, ensure that you can provide excellent service. In almost all cases, it will make sense to outsource cleaning, linen service, maintenance, and pest management. Guests should have ready access to a number to call in case of emergency, whether small or large.
If they walk into the property, and the refrigerator is full of the previous renter’s food, the air conditioner is a wall unit that doesn’t function, there is no Wi-Fi, or ants are crawling all over the countertops, the tone of their stay will be negatively impacted from the onset, and it will be difficult to recover.
What are your top three tips for people looking to invest in a vacation rental?
- First, select a destination you personally love and are committed to visiting on a regular basis. Even with a property management company on board, the owner’s personal touch is essential to ensure the upkeep of the property.
- Second, choose a destination that has a four-season appeal; otherwise, the income potential will be minimized. With this in mind, factor recurring costs into the purchase decision and rental rate. If you opt to invest in a property with massive, vaulted ceilings, the HVAC costs associated with this aesthetic may devour your profits.
- Third, select the best neighborhood you can afford. Safety and security are paramount to many renters, especially those with young children. Highlight safety features and the benefits of the selected neighborhood. Showcase both indoor and outdoor views of the property, as well as amenities located within a 10-mile radius.
Some cities and states impose strict regulations on short-term rentals. How can hosts ensure they’re following all applicable local and state regulations before advertising their space?
City and state governments have legitimate concerns regarding the negative impacts of neighborhoods being overrun with illegal short-term rentals.
The character, safety, and long-term appeal of a neighborhood will shift dramatically when confronted with a revolving door of visitors who are not invested in the community on a personal level.
Potential investors in rental properties must do their homework prior to purchase by reviewing dwelling laws, administrative codes, zoning resolutions, and legal consequences.
What hidden costs, if any, should short-term rental owners watch out for?
On the owners’ side, they must be aware of the income tax laws and liability insurance fees associated with renting out property. For renters, beware of the hidden costs of “resort fees,” a general misnomer that can apply to just about anything and is often tagged on at the last minute.
Be certain you are comparing apples to apples when conducting your search, as some companies estimate the total cost in their initial listing, and others wait until your booking process is almost finalized, when all of a sudden, the cost doubles.
What are the top three amenities that will attract the most guests?
Location, location, location.
With all things being equal, potential guests will compare properties within the same general vicinity. They will then move on to the layout of the property, with the number of bedrooms being a priority, as well as the presence or absence of key features, such as air conditioning.
Air conditioning has emerged as an important consideration as global warming has resulted in unbearably warm settings in destinations that are generally not reliant on this amenity, with owners who have not made the investment receiving critical online feedback.
What’s the outlook of the vacation rental industry for the next 1–3 years? What about the long term?
I am of the opinion that the vacation rental industry will face some significant challenges in the next 1-3 years, as the demand is exceeding the supply.
People that used to rent their houses are now selling them and moving into smaller homes that they don’t plan to rent. The problem is exacerbated by the supply chain issues and increased costs of housing, so there are fewer houses and rentals available.
I don’t have a crystal ball, but I expect that long term, the housing market and supply chain issues will correct themselves, thus enabling more houses on the market available to rent.
In a market that’s saturated with vacation rentals, how can an owner make theirs stand out from the competition?
Price and flexibility. Attention to detail. Owners can make their vacation rentals stand out by ensuring the rental is very clean and attractively furnished and providing several pictures to demonstrate that. In addition, aptly describing the property and all the amenities offered is key.
Vacationers want all of their needs taken care of and a home that is “well stocked.” Of course, waterfront property, a pool, or a hot tub would definitely make one’s property stand out amongst others that don’t offer that.
The rental home should be a reflection of its natural surroundings. If you are making a beach house, then the house should have the feel of a beach house. If it is located in a remote wooded setting, it should have rustic décor. If you are near a theme park, have at least one room that is devoted to that theme.
In general, your home should cater to the people that will rent it most frequently. Repeat business is the name of the game. You also want the home to feel comfortable; it is a good idea to create a house amenities checklist to make sure you’ve stocked up on everything a renter could need during their stay.
What are your top three tips for people looking to invest in a vacation rental?
- Location, Location, Location – you can’t go wrong with ocean or lakefront views, and a short drive to restaurants, bars, and stores is a plus. People like to walk, and having a safe and scenic place to walk is becoming a necessity.
- Property attraction inside and out, e.g., nicely landscaped, room for vacationers to play yard games, or proximity to open space, such as the beach, recreation trails, parks, etc., clean, well maintained, nicely painted, open floor concept, number of bathrooms commensurate with the number of bedrooms.
- Low maintenance property – After all, it’s a vacation home for the owners too, so when you’re there, you don’t want to have to be “fixing the house.”
Some cities and states impose strict regulations on short-term rentals. How can hosts ensure they’re following all applicable local and state regulations before advertising their space?
Talk to the planning board, chat with a local property management firm (as a tentative customer), and consult your local town website for information on the rules that govern short-term rentals. Typically, closing documents will also stipulate the “dos and don’ts” of rental regulations.
What hidden costs, if any, should short-term rental owners watch out for?
They aren’t really “hidden” costs, but there are variable costs. Specifically, the cost of energy is increasing at record rates, so rental owners need to be aware that guests may not be as considerate or “energy conscious” while renting, so the utilities are absolutely something they should watch out for.
What are the top three amenities that will attract the most guests?
- Water views
- Walking distance to shops, restaurants, live music, etc.
- Space, i.e., deck with nice outdoor furniture, a fireplace and/or hot tub
Methodology
First, we determined the factors (metrics) that are most relevant to rank the Best Cities to Own a Vacation Rental. We then assigned a weight to each factor based on its importance and grouped those factors into six categories: Legality, Revenue Potential, Initial Investment, Operating Expenses, Entertainment Options, and Guest Safety. The categories, factors, and their weights are listed in the table below.
For each of the 200 biggest U.S. cities, we then gathered data on each factor from the sources listed below the table. We eliminated 18 cities lacking sufficient data in a single category, resulting in a final sample size of 182 cities.
Finally, we calculated scores (out of 100 points) for each city to determine its rank in each factor, each category, and overall. A city’s Overall Score is the average of its scores across all factors and categories. The highest Overall Score ranked “Best” (No. 1) and the lowest “Worst” (No. 200).
Notes:
- The “Worst” among individual factors may not be No. 200 due to ties.
- The “Revenue Potential” data is based on listings for 1 bedroom, 1 bathroom, and 2 guests.
- “Number of Attractions” includes categories like cultural tours, museums and galleries, landmarks, nightlife options, parks, and live performances.
- While this study reflects the most recent data from our sources at the time of writing, always check local ordinances before investing in or listing a short-term rental property.
Sources: AllTheRooms, Federal Reserve Bank of St. Louis, HostScouts, National Oceanic and Atmospheric Administration, National Center for Disaster Preparedness, NeighborhoodScout, TripAdvisor, and U.S. Census Bureau
Final Thoughts: Airbnbust Breakdown
In 2022, Airbnb broke a record with 1.4 million rentals listed across the U.S. However, as listings continue to grow and competition booms in the short-term rental market, some cities are struggling to manage an exploding industry.
With a high supply of Airbnbs exacerbating local housing shortages and quiet neighborhoods transforming into gentrified tourist zones, cities are cracking down on STRs. While places like New York aren’t going so far as to ban short-term rentals, Airbnb is currently suing the City of New York over its new STR regulations, calling the rules a “de facto” ban.
While Airbnb’s overall revenue continues to rise, some hosts are seeing a major decrease in occupancy rates and profits. On top of everything, many travelers are now opting for hotels instead of rentals, with widespread STR scandals like hidden cameras, excessive rules, and even chore lists.
Some experts argue that targeting platforms like Airbnb and Vrbo wouldn’t do much to improve the housing crisis. STRs aren’t just for vacationers — many digital nomads live out of STRs, some using Airbnb as a safety net while in between apartments.
Airbnb also pledged to invest $25 million in affordable housing in California in 2019 and offered transitional housing to those impacted by the Maui wildfires.
Get ahead of the vacation rental competition by increasing your property value and upgrading your landscape. Hire a local LawnStarter pro to keep your rental property’s lawn and landscape looking fresh for your guests.
Media Resources
- High-resolution image of infographic
- High-resolution images of cities
- 2022’s Best Cities for Vacation Rentals ranking results
Main Photo Credit: Shutterstock