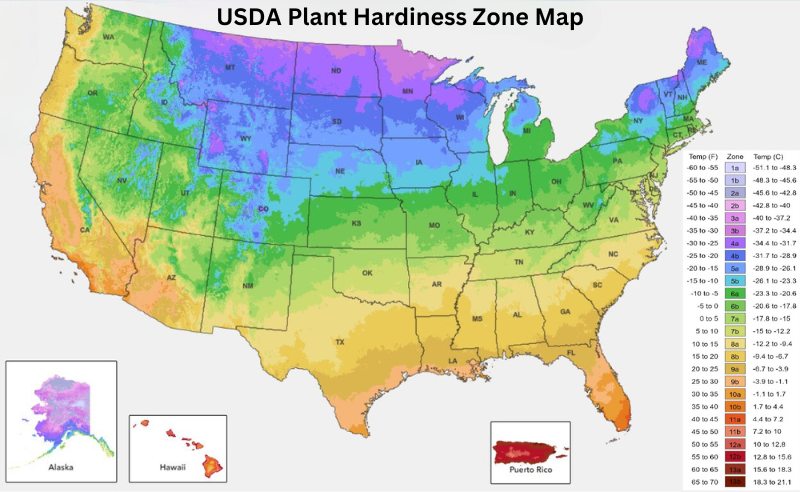
The USDA Hardiness Map is the go-to resource for many gardeners, and an updated map – the first in over a decade – shows it really is getting warmer across the U.S.
How much warmer? 2.5 degrees warmer than the 2012 map, Chris Daly, director of the PRISM Climate Group at Oregon State University, told NPR. The map is the result of research by USDA, PRISM, meteorologists, horticulturists and other scientists.
Daly says the new map means about half the country has shifted into a new half zone and half hasn’t. “In some locations, people may find they can grow new types of flowers, fruits, vegetables and plants,” he says.
In this article, I’ll show you how the USDA Hardiness Zone Map has changed, how to use the map when selecting plants, trees, and even grass for your yard, and note that this map is just the starting point when figuring out what greenery will best thrive in your yard.
What is the USDA Plant Hardiness Zone Map?

The map reflects weather data collected from 1990 to 2020 throughout the country, including Puerto Rico. Of particular interest is the average minimum temperature for a region – flowers, shrubs, trees – like some people – just can’t take the cold.
American beautyberry, for example, won’t be so beautiful if grown in Minneapolis, Detroit, or New York, for example. It’s best in the South and as far west and north as St. Louis.
The Hardiness Zone Map divides the country into 13 zones: 1a to 13b (-60 to 70 degrees Fahrenheit). From that info, the scientists developed zones with a 5-degree range for the lowest temperature.
Here are the average annual minimum winter temperatures for each zone:
Zone 1a: (-60 to -55 F/ -51.1 to -48.3 C)
Zone 1b: (-55 to -50 F/ -48.3 to -45.6 C)
Zone 2a: (-50 to -45 F/ -45.6 to -42.8 C)
Zone 2b: (-45 to -40 F/ -42.8 to -40 C)
Zone 3a: (-40 to -35 F/ -40 to -37.2 C)
Zone 3b: (-35 to -30 F/ -37.2 to -34.4 C)
Zone 4a: (-30 to -25 F/ -34.4 to -31.7 C)
Zone 4b: (-25 to -20 F/ -31.7 to -28.9 C)
Zone 5a: (-20 to -15 F/ -28.9 to -26.1 C)
Zone 5b: (-15 to -10 F/ -26.1 to -23.3 C)
Zone 6a: (-10 to -5 F/ -23.3 to -20.6 C)
Zone 6b: (-5 to 0 F/ -20.6 to -17.8 C)
Zone 7a: (0 to 5 F/ -17.8 to -15 C)
Zone 7b: (5 to 10 F/ -15 to -12.2 C)
Zone 8a: (10 to 15 F/ -12.2 to -9.4 C)
Zone 8b: (15 to 20 F/ -9.4 to -6.7 C)
Zone 9a: (20 to 25 F/ -6.7 to -3.9 C)
Zone 9b: (25 to 30 F/ -3.9 to -1.1 C)
Zone 10a: (30 to 35 F/ -1.1 to 1.7 C)
Zone 10b: (35 to 40 F/ 1.7 to 4.4 C)
Zone 11a: (40 to 45 F/ 4.4 to 7.2 C)
Zone 11b: (45 to 50 F/ 7.2 to 10 C)
Zone 12a: (50 to 55 F/ 10 to 12.8 C)
Zone 12b: (55 to 60 F/ 12.8 to 15.6 C)
Zone 13a: (60 to 65 F/ 15.6 to 18.3 C)
Zone 13b: (65 to 70 F/ 18.3 to 21.1 C)
Take USDA Zone 6a and 6b, for instance. USDA Zone 6b’s minimum average temperature is -5 to 0 degrees Fahrenheit. For Zone 6a, it is -10 to -5 degrees Fahrenheit.
Although the temperatures in the hardiness zones did not change, their bands or the regions of the country they cover did.
USDA Hardiness Map Changes
Here in Indiana, where I live and publish the Hoosier Gardener newsletter, the change on the map is pretty drastic. The big blob of blue in the middle of the state now has receded to the northern part of the state.
What does that mean for gardeners like myself? More flowers, trees, and plants can tolerate the slightly warmer average winter temps here.
No, we won’t be planting palm trees in Indiana, but green thumbs might be able to try their hand with some hardier tropical plants in southern parts of the state.
How have things changed? Using Indianapolis as an example, most of the city was in USDA Zone 6a in the 2012 map. With the new map, it’s in USDA Zone 6b, or 5 degrees Fahrenheit warmer.
FYI: Indianapolis moved from USDA Zone 5b to USDA Zone 6a when the 2012 map came out.
How to Use the Hardiness Zone Map
The Plant Hardiness Zone Map shows the average lowest temperature at which plants can survive in your region. So, how can you use this information? Click on the USDA Hardiness Zone Map online and key in your ZIP code to find your plant hardiness zone.
Even better, the new online map is ready to accept your GIS (Geographic Information System) for an even more precise reading of your hardiness zone.
The map is an excellent guide for selecting plants that are winter hardy in your area. If you know your average minimum temperature is minus 10 degrees, you want to make sure plants will be hardy to that temperature.
Plant tags, catalog and online resources almost always give the plant’s hardiness zone, and it will take a while until all of these are updated reflecting this map change.
Just what is plant hardiness?
Plant hardiness refers to the roots of a plant and its top growth. Many plants are root hardy, but their tops are killed by cold temperatures or they drop their leaves.
Deciduous plants, such as a maple tree, drop their leaves but their roots survive underground. With herbaceous perennials, such as coneflowers, the cold kills plants back to the ground, but the roots survive.
Limitations of the Hardiness Zone Map
The hardiness zone map details just that … winter hardiness. The map doesn’t tell gardeners how much heat a plant can take before it keels over.
Unfortunately, there isn’t an up-to-date plant heat zone map. For the West and Southwest, many gardeners rely on the Sunset Climate Zones, which better breaks down what plants can tolerate the sun and dry climate of these regions.
Other essential planting factors the USDA Plant Hardiness Zone Map does not cover include:
- Humidity
- Elevation
- Nearby bodies of water
- Available sunlight
- Wind
- Precipitation
- Frost dates
- Soil type
- Urban heat (urban areas are significantly warmer than surrounding rural areas).
Why does your specific geographic location, such as if you live near a lake, mountain or valley, matter when selecting plants for your yard? Those topographic formations influence temperatures.
A local resource for recommendations of plants for your regions is your cooperative extension office, or check with someone knowledgeable at your neighborhood garden center.
Or hire a LawnStarter landscaping pro to pick out, plant, and care for the plants in your yard.
Does the USDA Plant Hardiness Zone Map Apply to Turfgrass?
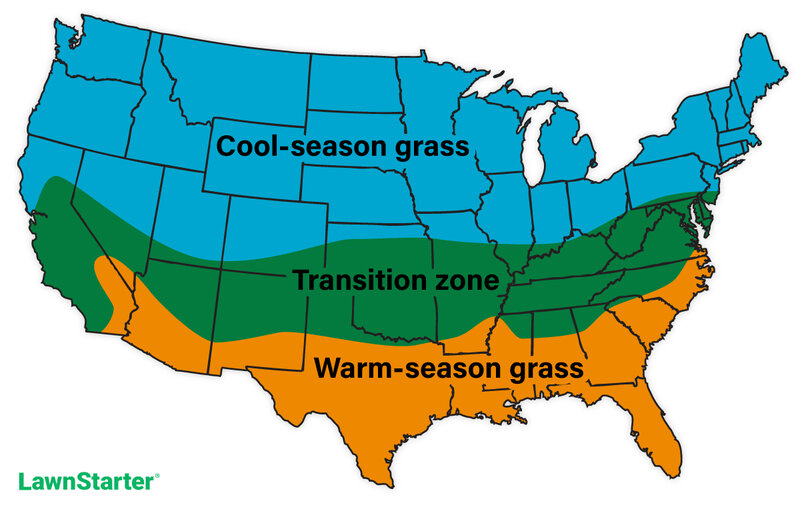
Although turfgrass is a plant, you don’t want to depend on the USDA Plant Hardiness Zone Map for choosing the best grass type for your yard. The map you want to use instead is the Transition Zone Map.

If you live up North, the best grass type for your yard will be cool-season grass. Cool-season grasses grow best in areas with low temperatures throughout most of the year. These grasses green up in early spring, go dormant when temperatures rise in summer, thrive in autumn, and enter winter dormancy when soil temperatures fall below 45 degrees Fahrenheit.
If you live down South, where temperatures are warm most of the year, you’ll want to plant warm-season grass. Warm-season grasses green up in spring, thrive in summer, and enter winter dormancy when soil temperatures drop below 55 degrees Fahrenheit.
The area sandwiched between the northern and southern states is the transition zone. You can grow either warm-season or cool-season grass if you live in the transition zone.
When to Hire a Lawn Care Pro
Now that your new plant selection will survive the winter, you’ll need to prepare for spring maintenance. From mulching the flower beds to dividing the perennials, the yard work piles up once you have successful plants. But that also means less free time on the weekends.
Hand your honey-do list over to a local landscape professional who will give your lawn and yard the ultimate care year-round. Once you let a lawn care expert cut the grass, mulch the flower beds, and trim the hedges, your neighbor will soon be the one admiring your yard.
Main Image Credit: Pxhere / CC0 1.0

![10 Best Electric Weed Eaters of 2025 [Reviews] weed trimmer trimming grass with text overlay on it](https://www.lawnstarter.com/blog/wp-content/uploads/2020/12/Best-Electric-Weed-Eaters.jpg)

![8 Best Cordless String Trimmers of 2025 [Reviews] person holding gasoline string trimmer with text overlay on it](https://www.lawnstarter.com/blog/wp-content/uploads/2021/01/Best-Cordless-String-Trimmers.jpg)
![10 Best Lawn Mowers for Small Yards in 2025 [Reviews] lawn mower cutting grass of small yards with text overlay on it](https://www.lawnstarter.com/blog/wp-content/uploads/2021/01/Best-Lawn-Mowers-for-Small-Yards.jpg)