
What are the best cities to perfect your swing and nail that birdie?
For those thankful next week for 18 holes (if not a hole-in-one), LawnStarter ranked 2025’s Best Cities for Golfers.
We compared the 500 largest U.S. cities based on 6 categories. We considered the number of public and private golf courses, PGA courses with public access, driving ranges, amateur competitions, and average course consumer rating, among 27 total metrics.
Tee off with our ranking below. To learn how we ranked the cities, see our methodology.
Contents
- City Rankings
- Top 5 Close Up
- Key Insights
- Ask the Experts
- Methodology
- Final Thoughts: Golf Tech and Turkey Day
City Rankings
See how each city fared in our ranking:
Top 5 Close Up
Check out the slideshow below for highlights on each of our top 5 cities.

No. of Public Golf Courses within 20 miles: 54 | Rank: 11
Number of Top 100 Golf Courses in the U.S. (Golf Digest): 1 | Rank: 3
Number of PGA Courses Available for Public Play: 1 | Rank: 1
Number of Golf Resorts: 8 | Rank: 2
Number of Golf Equipment Stores: 22 | Rank: 2
Local tips: Experience Scottsdale golf at its finest with TPC Scottsdale, where the pros play. For a unique twist, check out Troon North Golf Club for stunning desert landscapes and challenging fairways.
Share your love of golf with family and friends at PopStroke Scottsdale. Designed by Tiger Woods, this spot combines two 18-hole mini-golf courses with a full restaurant and sports bar.
Photo Credit: Don / flickr / License

No. of Public Golf Courses within 20 miles: 74 | Rank: 6
Number of Golf Resorts: 7 | Rank: 3
Number of Driving Ranges: 12 | Rank: 9
Number of Golf Equipment Repair Shops: 5 | Rank: 4
Number of Amateur Golf Competitions and Tournaments: 12 | Rank: 4
Local tips: Tee off at Papago Golf Club for a true desert golf experience with scenic mountain views and challenging greens. For a top-tier course in the heart of the Phoenix Mountain Preserve, visit the renovated Arizona Biltmore Golf Club, known for its manicured fairways and historic charm.
Head over to Topgolf Phoenix for a social take on the game, mixing competitive golf with great food and a lively atmosphere.
Photo Credit: Nader Abushhab / Unsplash / License

Number of Top 100 Golf Courses in the World (Golf Magazine): 2 | Rank: 1
Number of Top 100 Golf Courses in the U.S. (Golf Digest): 2 | Rank: 1
Number of Facilities Offering Golf Lessons: 42 | Rank: 1
Number of PGA Golf Coaches: 13 | Rank: 21
Number of Amateur Golf Competitions and Tournaments: 12 | Rank: 4
Local tips: Play like the pros at the members-only Riviera Country Club in Pacific Palisades, a favorite PGA Tour stop with fantastic views. For a more laid-back scene, Rancho Park Golf Course is a classic public course that is affordable and full of local charm.
Looking to practice with a view? Visit Westchester Golf Course near LAX for quick rounds and a night-time lit-up driving range. Afterward, swing by the recently restored Clubhouse at Griffith Park for food and drinks with fellow golf fans.
Photo Credit: Daniel Semenov / Pexels / License
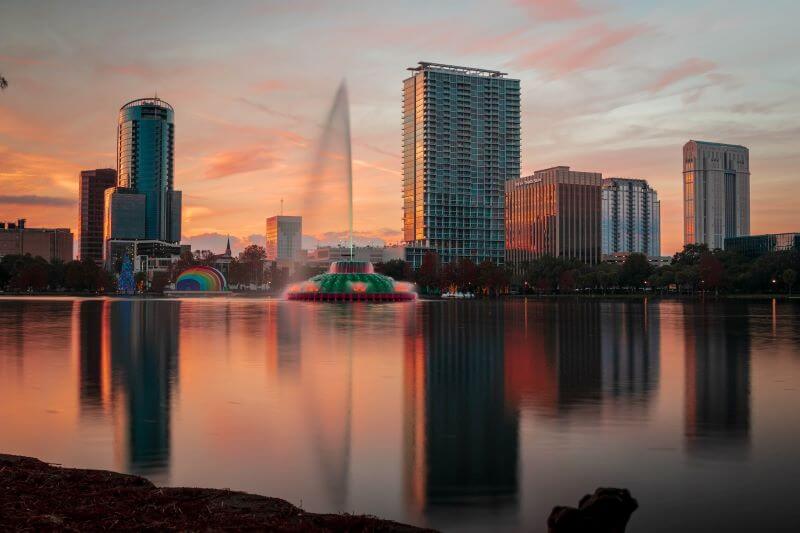
Number of Best Golf Courses for Public Access (Golfweek Magazine): 1 | Rank: 1
Number of PGA Courses Available for Public Play: 1 | Rank: 1
Number of Golf Resorts: 10 | Rank: 1
Number of Driving Ranges: 15 | Rank: 5
Number of PGA Golf Coaches: 20 | Rank 5
Local tips: Start your day at the Bay Hill Club & Lodge, renowned for hosting the Arnold Palmer Invitational and featuring challenging fairways. For a unique experience, visit Orange County National Golf Center, home to two championship courses and America’s largest driving range.
Unwind at Eagles Edge, Orlando’s premier Toptracer driving range and restaurant. With 30 hitting bays, a full bar, and over 40 TVs, it’s the perfect spot to relax.
Photo Credit: M-DESIGNZ / Pexels / License

No. of Private Golf Courses within 20 miles: 57 | Rank: 9
Number of Driving Ranges: 11 | Rank: 11
Number of Indoor and Virtual Golf Facilities: 7 | Rank: 1
Number of Facilities Offering Golf Lessons: 39 | Rank: 2
Google Search Interest: 62,000 | Rank: 1
Local tips: Take a swing at Bethpage State Park Golf Course in nearby Long Island, a world-renowned public course that’s hosted the U.S. Open. For another escape from the city, check out Pelham Bay & Split Rock Golf Course in the Bronx, where you can play 36 scenic holes surrounded by parkland.
Cap off the day at NYC Flatiron in Manhattan, a unique indoor golf venue with simulators, a full bar, and lessons.
Photo Credit: Michał Ludwiczak / Pexels / License
Key Insights
Arizona tees up three spots in the top 10, with Scottsdale (No. 1), Phoenix (No. 2), and Mesa (No. 8) claiming prime positions — even triple-digit temps don’t keep golfers off the greens in the Grand Canyon State. These cities shine with plentiful public courses, driving ranges, golf resorts, and a strong lineup of amateur competitions.
New York (No. 5) makes a surprising swing into the top 5, proving you don’t need endless greens to be a golf hotspot. While you might have to venture beyond Manhattan for a full round, the city scores high with many driving ranges, indoor virtual golf setups, and abundant lessons. Plus, New Yorkers prove their love for the game is anything but miniature, dominating Google search interest.
Florida’s golf scene balances luxury and accessibility, with West Palm Beach (No. 58) reigning in exclusivity, boasting more private courses than public courses. For public course access, head north to Orlando (No. 4), where golfers can enjoy top-notch fairways, including a Golfweek top 100 public course.
Only three northern cities break into the top 25 — New York (No. 5), Chicago (No. 7), and Denver (No. 11). Chicago stands out with a wealth of municipal courses (run by local agencies and open to all), high search interest, plus tons of gear shops and indoor ranges.
Land more insights below.
Ask the Experts
Mastering your golf game can be a rewarding pursuit, but how do you know you’re on the right track?
We turned to a group of golf experts for their best advice on everything from choosing the right clubs to understanding how weather affects your ball’s flight and tips for finding courses that match your skills. Dive into their insights below.
- How might regional turf types affect a player’s ability to strike the ball?
- How might climate or weather impact ball flight?
- What clubs should every player have in their golf bag?
- Is it necessary to get fitted for clubs? Why or why not?
- How should a player choose courses that are best suited for their game?
- What is your best tip for getting better at golf?

How might regional turf types affect a player’s ability to strike the ball?
Golf courses use different types of grasses in their fairways, roughs, and greens, which can affect various aspects of the game, including:
- Ball flight
- Roll and bounce
- Spin
- Overall playability
The regional turf composition influences a golfer’s contact with the ball or the ability to strike the ball.
How might climate or weather impact ball flight?
Weather conditions have a significant impact on ball flight including temperature, humidity, wind, rain, and elevation. If you play golf in the Colorado Rocky Mountains at high elevation, you often need to club down a bit.
What clubs should every player have in their golf bag?
Clubs are designed for various situations on the golf course and what clubs are needed depends on skill level and individual preference.
For a high handicap or beginner, at a minimum, a player should carry:
- A driver or 3 wood to get distance off the tee for long par 5s and 4s.
- A few hybrid woods for longer shots from the tee, fairway, or rough.
- Irons that are versatile, including 5 to 9 for a wide range of distances.
- A pitching and sand wedge.
- Absolutely a putter.
As you get better, you can start adding different clubs.
Is it necessary to get fitted for clubs? Why or why not?
For beginners and casual golfers, custom-fitted clubs are not necessary. This can be a substantial financial investment. Before making this investment, it’s a lot cheaper and easier to practice on the driving range.
How should a player choose courses that are best suited for their game?
A player should choose a golf course by considering several factors including:
- Skill level
- Handicap
- Tee-box selection
- Objectives for a round of golf
- Course difficulty and length
- Course reviews
- Speaking to local golfers
What is your best tip for getting better at golf?
The best tip for getting better at golf is to focus on consistency.
To improve consistency, work on fundamentals by:
- Practicing
- Taking lessons
- Developing a pre-shot routine
- Course management
- Staying fit and flexible
- Setting realistic goals for each round
Methodology
First, we determined the factors (metrics) that are most relevant to rank the Best Cities for Golfers. We then assigned a weight to each factor based on its importance and grouped those factors into 6 categories:
- Public Course Access
- Premium Course Access
- Training & Equipment Access
- Course Quality
- Golf Community & Engagement
- Climate Factors
The categories, factors, and their weights are listed in the table below.
For each of the 500 biggest U.S. cities, we then gathered data on each factor from the sources listed below the table.
Finally, we calculated scores (out of 100 points) for each city to determine its rank in each factor, each category, and overall. A city’s Overall Score is the average of its scores across all factors and categories. The highest Overall Score ranked “Best” (No. 1) and the lowest “Worst” (No. 496).
Notes:
- The “Worst” among individual factors may not be No. 496 due to ties.
- Bridgeport, CT; South Fulton, GA; Jurupa Valley, CA; and Spokane Valley, WA, were excluded from our ranking due to insufficient data.
Sources: golflink, Golf Tournament Association of America, GOLF, Golf Digest, Golfweek, GolfPass, PGA of America, Yelp, AMATEURGOLF.COM, Meetup, National Centers for Environmental Information, Google Keyword Planner, and The Real Yellow Pages
Final Thoughts: Golf Tech and Turkey Day
Golf is evolving. GPS golf watches are transforming the way players navigate courses, providing instant distances to the green and helping golfers select the perfect club without guesswork. AI-driven apps like Mustard Golf analyze swing and offer personalized feedback.
AI’s influence doesn’t stop at individual performance. Innovation in course management, like AI-driven turf care, ensures that greens are more sustainable and eco-friendly than ever. And for extreme fans, virtual golf platforms enhanced by AI offer an immersive yet expensive experience.
Come spring, green up your lawn with some of these helpful tips and practice your short game at home in your own backyard:
- Keep your grass at the optimal height for your region to ensure a smooth putting surface.
- Water deeply but infrequently to promote strong roots.
- Use a balanced fertilizer to replenish nutrients.
- Aerate annually to improve drainage and reduce compaction.
- Overseed bare patches to create a seamless surface for your backyard golf game.
Oh, and who says golf and Thanksgiving don’t mix? With family gathered close and the holiday buzz in full swing, sneaking away to the links can be a much-needed breather — plenty of courses stay open on Turkey Day.
Or better yet, get the whole family involved. Head to the country club for all the turkey and trimmings, and skip the stress of cooking and cleaning.
Need to catch up on your yard work so you can spend more time on the links? Hire a local LawnStarter pro to handle it while you perfect your putt and enjoy the great outdoors.
Media Resources
Quotes from LawnStarter Editor-in-Chief Jeff Herman
- Bloomington, IN, (No. 494), Fargo, ND, (No. 495), and New Britain, CT, (No. 496) land in the rough, falling at the bottom of the ranking with limited access to golf courses, less-than-ideal climates, lower course quality, and fewer training opportunities.
- 7 Arizona cities claim the highest number of public courses. Leading the pack is Mesa (No. 8) with 80.
- California and Illinois lead the way in municipal golf courses. 7 cities claim the top spots with Schaumburg, IL, (No. 36) and Downey, CA, (No. 19) taking the top 2 spots.
- Florida and New York dominate in exclusivity, with cities like West Palm Beach (No. 58) and New Rochelle (No. 193) leading in private golf courses.
- Golfers can test their skills in Las Vegas (No. 6), Sacramento (No. 101), and San Antonio (No. 21), hosting the highest number of amateur competitions.
- Los Angeles (No. 3), New York (No. 5), and San Diego (No. 17) top the leaderboard for golf facilities offering lessons, making them prime spots for sharpening your skills.
- Gofers can improve their game in New York (No. 5), Houston (No. 9), and Chicago (No. 7), leading the nation in virtual golf facilities, while Fort Myers, FL, (No. 23), Charlotte, NC, (No. 25), and Louisville, KY, (No. 113) offer the highest numbers of PGA-certified coaches for world-class guidance.
- High-resolution images of cities
- 2023’s Best Cities for Golfers ranking results
- 2022’s Best Cities for Golfers ranking results
- 2021’s Best Cities for Golfers ranking results
Main Photo Credit: StockLite / Shutterstock / License