Where in the U.S. can the LGBTQ+ community feel proudest and safest to live?
To mark Pride Month, LawnStarter ranked 2023’s Most LGBTQ-Friendly Cities.
We compared the 200 biggest U.S. cities based on 20 indicators of an ideal LGBTQ city, such as anti-discrimination policies, the share of same-sex households, and LGBTQ support resources.
We also factored in affordability, LGBTQ-friendly health care access, and Pride-readiness.
Find out which cities are best for LGBTQ+ folks below. To learn how we ranked the cities, see our methodology.
Contents
- City Rankings + Infographic
- Top 5 Close Up
- Key Insights
- Ask the Experts
- Behind the Ranking
- Honorable Mentions
City Rankings + Infographic
See how each city fared in our ranking:
Top 5 Close Up
Check out the slideshow below for highlights on each of our top five cities.
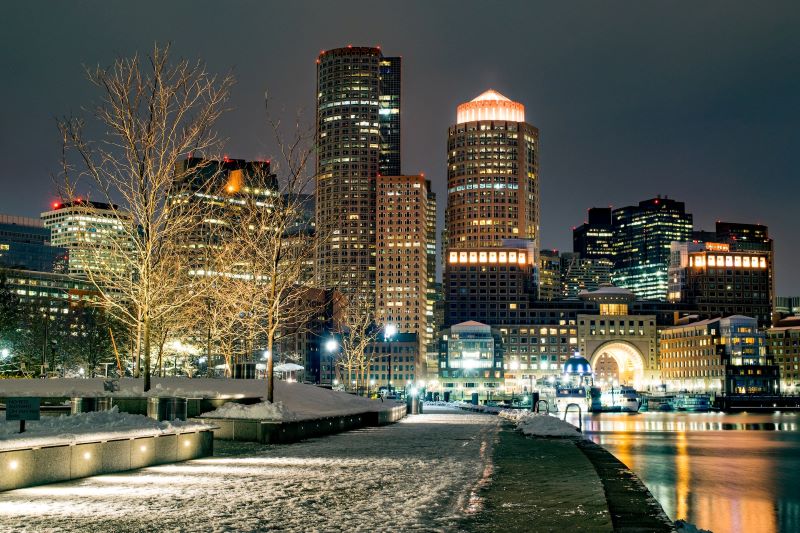
Equality: 4
Community Support: 3
Affordability: 63
Health Care Access: 10
Pride-Readiness: 4
Photo Credit: KEHN HERMANO / Pexels / Pexels License
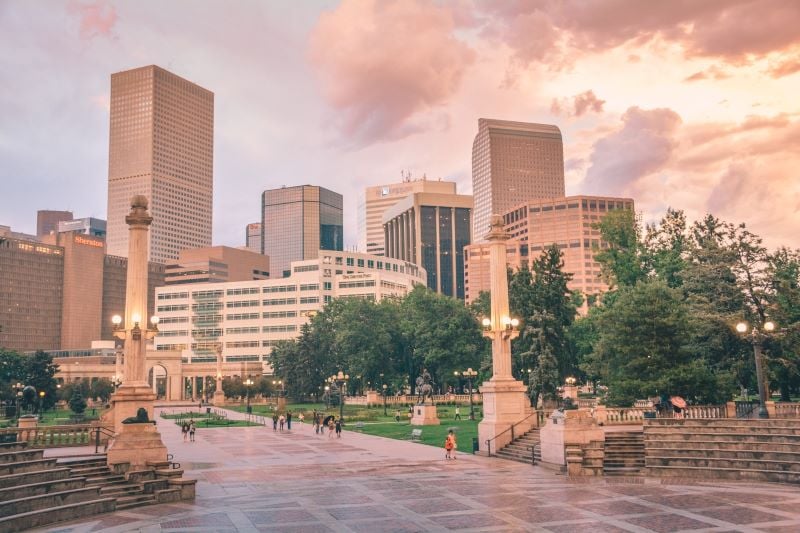
Equality: 19
Community Support: 4
Affordability: 54
Health Care Access: 3
Pride-Readiness: 10
Photo Credit: Pixabay / Pexels / Pexels License
Equality: 30
Community Support: 8
Affordability: 32
Health Care Access: 7
Pride-Readiness: 14
Photo Credit: Josh Fields / Pexels / Pexels License
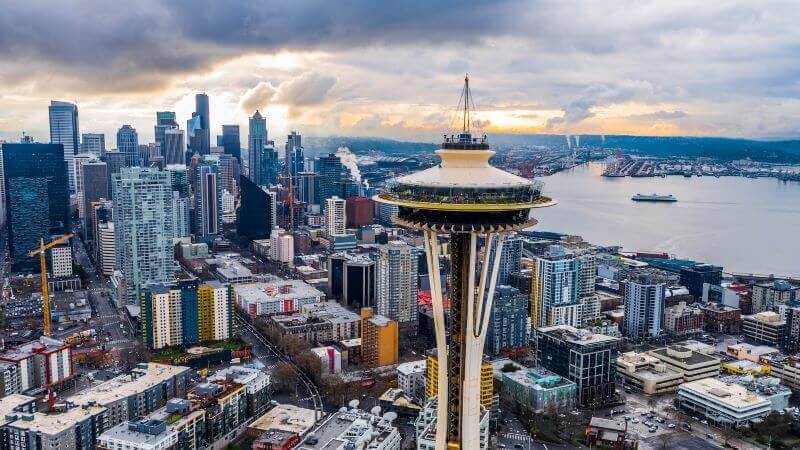
Equality: 1
Community Support: 12
Affordability: 28
Health Care Access: 12
Pride-Readiness: 16
Photo Credit: Arpan Parikh / Pexels / Pexels License
Equality: 20
Community Support: 9
Affordability: 124
Health Care Access: 2
Pride-Readiness: 45
Photo Credit: Nate Hovee / Pexels / Pexels License
Key Insights
The Gist
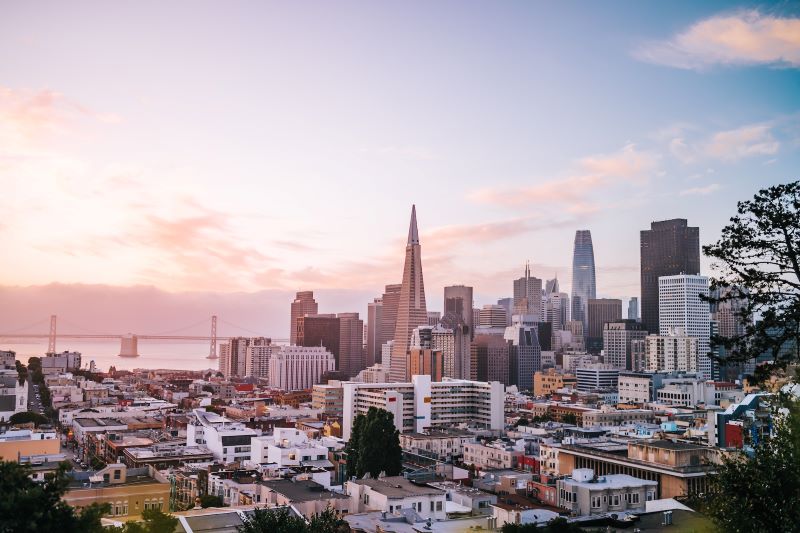
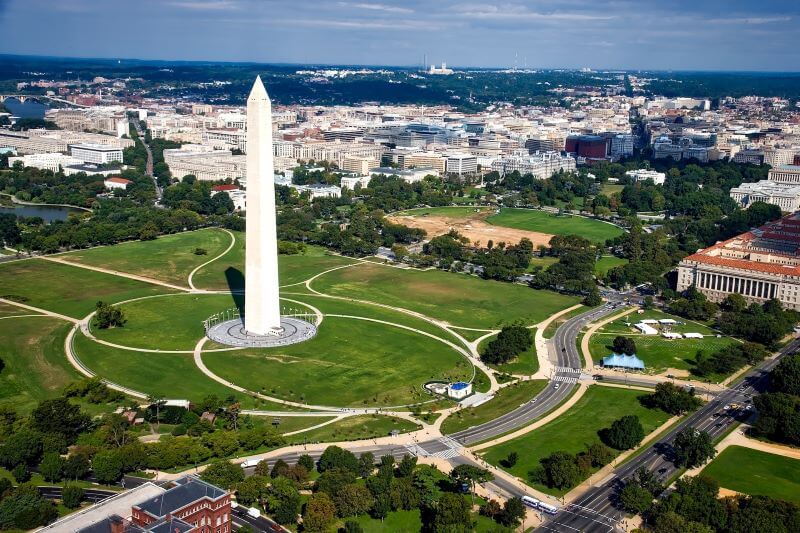
The top of our ranking is dominated by liberal strongholds like San Francisco (No. 1), Washington (No. 2), and Denver (No. 4). These cities tend to be the most progressive — at least at the municipal level — so feel free to say “gay” here. Although generally not the most affordable, our top performers boast strong LGBTQ+ communities.
All but nine of our 50 bottom cities, on the other hand, are located in the South. Although the region is hailed for its warm, welcoming vibe, our data suggests otherwise for LGBTQ+ incomers. The South tends to impose unwelcoming policies on and lacks helpful resources for its queer community. Florida, Georgia, and Texas cities make up the bottom 10.
There are, of course, exceptions on both ends.
Standout Stats
True Colors
Alaska is the only red state among the 20 states (plus the District of Columbia) that have not passed at least one of the 83 anti-transgender bills introduced in 2023 (at the time of data collection). Three are purple (swing) states: Nevada, New Mexico, and Virginia. So far, North Dakota has passed the most bills, 11.
LGBTQ-Unfriendly Florida
Of the 18 states with active “Don’t Say Gay” bills, only Florida has passed such legislation.
Sunny Safe Havens
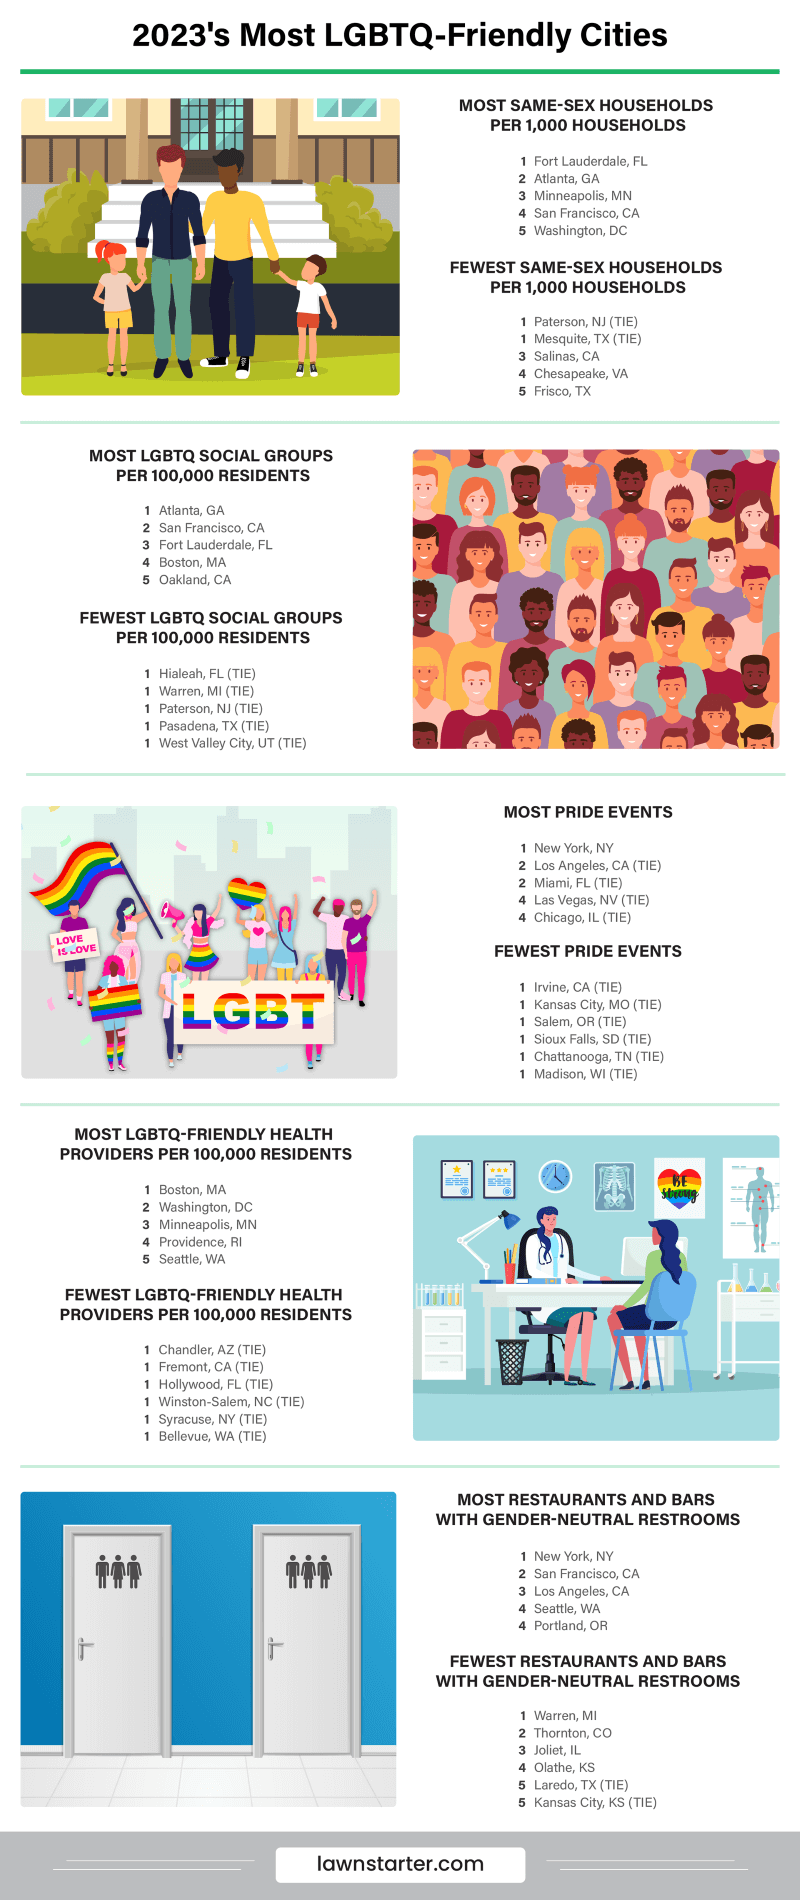
Despite Florida’s unwelcoming politics, Fort Lauderdale (No. 18 overall) is home to the biggest concentration of same-sex households among the 200 biggest U.S. cities. St. Petersburg (No. 110), Hollywood (No. 168), Tallahassee (No. 162), and Orlando (No. 34) aren’t far behind. Several of these cities are popular gay travel destinations.
Georgian Contradiction
Of our top 10 cities, only Atlanta (No. 10) ranked in the bottom half of our Equality category, at No. 128. Despite Georgia’s unfriendly policies toward its LGBTQ+ residents, those living in The Big Peach can feel safe and welcome — Atlanta ranked 2nd in Community Support. The city also boasts the 2nd-highest concentration of same-sex households.
Twins of a Different Cloth
Some “twin” cities performed differently in our ranking — one tends to be more inclusive and progressive than its sibling. Among the duos with the biggest gaps in overall rank are Minneapolis (No. 19) and St. Paul, Minnesota (No. 68); Dallas (No. 57) and Fort Worth, Texas (No. 129); and Fort Lauderdale (No. 18) and Miami, Florida (No. 144).
Battle of the Sixes
In Utah, Salt Lake City (No. 20 overall) and its suburb West Lake Valley (No. 185) landed on opposite ends of our Health Care Access category. SLC placed 6th best, whereas WVC placed 6th worst. This outcome may be a reflection of the declining Mormon population in Salt Lake City and its continued domination in West Valley City.
Waterful Drinking Holes
Stay hydrated during Pride in one of the cities with the highest concentrations of gay bars and clubs. Strangely, eight of the 10 best cities in this metric are by water. In first place is New Orleans (No. 53 overall), followed by other seaside or riverside cities like San Francisco (No. 1), Providence, Rhode Island (No. 15), Pittsburgh (No. 8), and Seattle (No. 3).
Rest Easy
Transgenders, genderqueers, and gender non-conformists can easily find inclusive restrooms in the biggest U.S. cities. Half of the 10 cities with the fewest gender-neutral bathrooms at bars and restaurants, however, are in the Midwest, such as Warren, Michigan (No. 157), Kansas City, Kansas (No. 124), and Akron, Ohio (No. 101). The other half are mostly in the South.
The Party Never Stops
Missed your city’s Pride festival? Head to The City That Never Sleeps — once the Canadian wildfire smoke clears. New York has nine Pride events scheduled throughout the year — mostly during the warmer months — and those are just the major shindigs. Check your local event calendars for smaller affairs. Los Angeles (No. 12) and Las Vegas (No. 17) are good options for westward travelers.
Ask The Experts
Since achieving marriage equality, politics and the pandemic have reshaped the way LGBTQ+ people live. To help the community navigate those changes, we reached out to experts for insights and tips. See what they had to say below.
- What are three hallmarks of the best LGBTQ+ city?
- What can cities do to protect their LGBTQ+ communities from statewide anti-LGBTQ legislation?
- What are your top three tips for someone who is planning to attend their local Pride festival for the first time this year?
- What is your best piece of advice for LGBTQ+ people who are looking for a community or safe space in states with anti-LGBTQ policies?
- How can local businesses and leaders help make their communities more inclusive and safe for LGBTQ+ people?

What are three hallmarks of the best LGBTQ city?
Three key hallmarks underscore a city’s standing as a top destination for the LGBTQIA+ community.
1. Firstly, a warm and open ambiance created by inclusive restaurants and stores serves as a significant marker. This includes a strong commitment to fostering safe spaces where everyone — regardless of their sexual orientation or gender identity — feels welcome and respected.
2. Secondly, a vibrant LGBTQIA+ nightlife characterizes a city that is not only accepting, but celebratory, of diverse lifestyles. This typically entails a broad array of bars, clubs, and social venues where individuals can freely express their identities.
3. Lastly, a city with a robust LGBTQIA+ community stands as a beacon of solidarity, acceptance, and diversity. The existence of various LGBTQIA+ groups and organizations, as well as events and gatherings, is an affirmation of the city’s dedication to championing LGBTQIA+ rights.
What can cities do to protect their LGBTQ communities from statewide anti-LGBTQ legislation?
Cities can safeguard their LGBTQ communities from statewide anti-LGBTQ legislation through proactive and inclusive civic engagement.
One effective strategy is to host town halls — inviting residents to learn about the new legislation and how it might impact their community. Here, local government officials can elucidate the implications of these laws, helping community members better understand their rights and potential challenges.
Further, during these discussions, they can disclose what actions the city will undertake to safeguard their citizens’ rights. This level of transparency will help to build trust and ensure that the community is well-prepared and informed about any potential changes.
What are your top three tips for someone who is planning to attend their local pride festival for the first time this year?
If you’re planning to attend your local pride festival for the first time this year, there are three key tips that could enhance your experience.
1. First and foremost, embrace the opportunity to be yourself. Pride is a celebration of diversity, individuality, and acceptance, and it offers a unique platform to express who you are within your community.
2. Secondly, consider bringing a friend along to share in the festivities. The experience of attending a Pride event can be enriched by the presence of a supportive companion.
3. Finally, aim to attend as many events as possible and make a concerted effort to meet new people. Engaging with the diverse individuals that constitute the LGBTQIA+ community can be an enriching and enlightening experience.
What is your best piece of advice for LGBTQ people who are looking for a community or safe space in states with anti-LGBTQ policies?
For LGBTQIA+ individuals residing in states with anti-LGBTQ policies, finding a safe space or community can be challenging.
In such scenarios, a vital first step is to get involved with local LGBTQIA+ organizations. These organizations often serve as safe havens, providing not only a supportive community but also resources, advocacy, and assistance to navigate any challenges or discrimination that may arise due to such policies.
How can local businesses and leaders help make their communities more inclusive and safe for LGBTQ people?
Local businesses and leaders play an integral role in fostering inclusivity and safety for LGBTQIA+ individuals within their communities.
- Implementing trainings for elected leaders is one effective measure, which can help to educate them about LGBTQIA+ rights and the importance of inclusivity.
- Similarly, displaying the Pride Flag during June, known internationally as Pride Month, is a potent visual testament to a community’s support for its LGBTQIA+ citizens.
- Moreover, engaging with the Pride Month festivities, whether by hosting events, sponsoring parades, or simply participating, is a vital part of affirming their support for and commitment to the LGBTQIA+ community.
- Similarly, displaying the Pride Flag during June, known internationally as Pride Month, is a potent visual testament to a community’s support for its LGBTQIA+ citizens.
What are three hallmarks of the best LGBTQ city?
1. Progressive social policies that foreground acceptance and non-discrimination.
2. Robust services and cultural activities — from housing or medical support to Pride events.
3. Some degree of queer urban density that you find in a “gayborhood.”
What can cities do to protect their LGBTQ communities from statewide anti-LGBTQ legislation?
Cities can enact anti-discrimination policies and beef up support services, especially for those likely to be most impacted, such as youth, poor people, people of color, and trans folks.
What are your top three tips for someone who is planning to attend their local pride festival for the first time this year?
1. Bring sunscreen.
2. Bring a battery pack.
3. Bring a fanny pack to keep the above in.
What is your best piece of advice for LGBTQ people who are looking for a community or safe space in states with anti-LGBTQ policies?
Don’t lose hope. Queer people are everywhere and social attitudes are changing. Current anti-LGBTQ policies are the last reactionary gasps of a small minority. Often one can find really supportive and welcoming community in these states because it is so needed.
How can local businesses and leaders help make their communities more inclusive and safe for LGBTQ people?
Businesses and local leaders can serve to enact anti-discrimination policies and ensure that local LGBTQ folk are represented and visible.
What are three hallmarks of the best LGBTQ city?
1. Spaces and opportunities that are fully inclusive—e.g. age, race, ability, economics, language, location.
2. The availability of a rich diversity of meaningful resources that are accessible; meaningful wrap-around services.
3. Elected officials, business and community leaders working collaboratively to plan and drive policy and programs mindful of queer communities
What can cities do to protect their LGBTQ communities from statewide anti-LGBTQ legislation?
Employ advocates and lobbyists who will be in front of anti-legislation. In my home city, the mayor created an Office of LGBTQ+ Advancement. There are similar roles on the state level.
What are your top three tips for someone who is planning to attend their local pride festival for the first time this year?
1. Bring a comfy chair and water.
2. Come ready to have a good time.
3. Say hi to everyone.
What is your best piece of advice for LGBTQ people who are looking for a community or safe space in states with anti-LGBTQ policies?
I recently heard a story about community found in lesbian bars.
- Search for organizations and businesses that display LGBTQ and/or progressive flags.
- Visit social media with local online groups.
How can local businesses and leaders help make their communities more inclusive and safe for LGBTQ people?
Invite the LGBTQ community into their spaces via signage, people, and branding.
What are three hallmarks of the best LGBTQ city?
- The “best” LGBTQ city is one where LGBTQ people are supported as our whole selves. This includes our sexuality, gender, race, national origin, faith, and more. Keep in mind that a “gayborhood” may feel like home to some and not others. Support should not be clustered in a single area but spread throughout the city.
- There is concrete support, not just symbolic support. Concrete: actionable laws, policies, and practices to protect LGBTQ residents. Symbolic: flying a flag but not doing much else.
- The best LGBTQ city must be immigrant-friendly. Gender and sexual rights and protections must be available to all people and not limited to citizens.
What can cities do to protect their LGBTQ communities from statewide anti-LGBTQ legislation?
Cities do have some leeway to protect their residents, and there is a historical precedent for this.
For example, in my state — Michigan — some cities passed ordinances prohibiting discrimination based on sexual orientation before the state did. Leadership and the spark for change often happen at the city level.
What are your top three tips for someone who is planning to attend their local pride festival for the first time this year?
1. Share the experience with your loved ones if you feel comfortable doing so. Some people have major misconceptions about pride. Your story may help them to open their minds and hearts.
2. Enjoy the sheer diversity of our community.
3. Wear sunscreen.
What is your best piece of advice for LGBTQ people who are looking for a community or safe space in states with anti-LGBTQ policies?
I advise all of us to seek out and foster intergenerational relationships. We need the wisdom of our LGBTQ elders now more than ever. And LGBTQ young people who are younger than we are need to see us to know that a future is possible.
How can local businesses and leaders help make their communities more inclusive and safe for LGBTQ people?
Stand up for us even when it is not popular or profitable. Everyone jumps on the wagon when it appears to be good for the bottom line. But LGBTQ people notice who stands up for us when there is something to lose. That kind of integrity sends a message.
What are three hallmarks of the best LGBTQ city?
1. A supportive leadership, including mayors and council members, school boards, and chambers of commerce.
2. Affirming Healthcare, including hospitals and clinics as well as individual providers. There is nothing worse than going to the ER and having the providers decide your health problems must be connected to your HIV status.
3. An affirming (not merely tolerant) spiritual community and churches.
What can cities do to protect their LGBTQ communities from statewide anti-LGBTQ legislation?
Make sure that sexual identity and gender performance is included in the city’s and county’s antidiscrimination policies and those are applied for housing, employment, and commerce.
Cities and counties should have some LGBTQ+ representation on their councils, school boards, and committees. Leadership—specifically mayors—should be affirming and even celebratory when it comes to Pride Month, the Arts, Theater and LGBTQ+ local history. Leadership can encourage respect for individuals and groups and support businesses that are “gay friendly.”
Support individuals who may be fighting discriminatory legislation with legal representation and by not conceding state legislation that goes against the city’s values and ordinances. Don’t cancel public events out of fear of reprisals.
What are your top three tips for someone who is planning to attend their local pride festival for the first time this year?
1. Have fun, wave a flag, cheer, wear a rainbow.
2. I have not felt unsafe at Pride Events for at least the past 10 years, so my tips are what I would say for anylarge event: don’t drink too much alcohol, remember where you parked, don’t go off with strangers—no matter how good looking.
3. If you liked the event, seek out the organizers and get involved in the next year’s planning.
What is your best piece of advice for LGBTQ people who are looking for a community or safe space in states with anti-LGBTQ policies?
I live in a state with anti-LGBTQ+ policies, but the community I live in is safe. Do not write off an entire state because we need LGBTQ+ individuals to fight alongside with us.
You can find people to talk to on Social Media, and look for the “Gay” newspaper, an LGBTQ+ Center, an affirming church and affirming employers. Ask the LGBTQ+ people who have lived in the area for a number of years why they live there and why they stay.
Visit the area a number of times and look for those things that you enjoy for leisure—sports, arts, theater, music—are there LGBTQ+ people involved?
How can local businesses and leaders help make their communities more inclusive and safe for LGBTQ people?
Think about how you present yourselves to the public.
- How can your signage, advertisements, brands, etc. be more inclusive?
- You may be Christian, but is that the most important thing about your business? (Understand that “Christian” is a trigger for many people in the LGBTQ+ community.)
- How do you treat your employees? What messages do they receive about their inclusion?
If your businesses and stores are welcoming to everyone — and it shouldn’t matter if you are a single business or part of a chain — you have created an inclusive community.
Behind the Ranking
First, we determined the factors (metrics) that are most relevant to rank the Most LGBTQ-Friendly Cities. We then assigned a weight to each factor based on its importance and grouped those factors into five categories: Equality, Community Support, Affordability, Health Care Access, and Pride-Readiness. The categories, factors, and their weights are listed in the table below.
For each of the 200 biggest U.S. cities, we then gathered data on each factor from the sources listed below the table.
Finally, we calculated scores (out of 100 points) for each city to determine its rank in each factor, each category, and overall. A city’s Overall Score is the average of its scores across all factors and categories. The highest Overall Score ranked “Best” (No. 1) and the lowest “Worst” (No. 200). Note: The “Worst” among individual factors may not be No. 200 due to ties.
Sources: CenterLink, EducationWeek, Gay Pride Calendar, GreatNonprofits, Human Rights Campaign, LGBTQ+ Healthcare Directory, Meetup, misterb&b, Movement Advancement Project, National LGBT Chamber of Commerce, PFLAG, Psychology Today, Trans Legislation Tracker, U.S. Census Bureau, and Yelp
Honorable Mentions
Besides the cities on our leaderboard, there are many other “gay meccas” that didn’t rank due to size but bear mentioning. Check out some of the queer cities that deserve a shoutout below.
- Juneau, Alaska: Earning all 100 points on the Human Rights Campaign’s Municipal Equality Index, this small Alaska town protects and celebrates its LGBTQ+ residents.
- Provincetown, Massachusetts: Thanks to its warm Portuguese residents, Ptown grew into one of the most popular gay destinations, attracting queer beachgoers throughout the year.
- Lost River, West Virginia: Don’t let the name fool you — you’ll feel a sense of belonging in Lost River, just two hours from Washington. Book a quiet weekend at Guesthouse Lost River and explore the town’s gay scene.
- Eureka Springs, Arkansas: Dubbed “The Gayest Small Town in America,” Eureka Springs was a hotspot for LGBTQ+ couples looking to tie the knot — through a domestic partnership — before same-sex marriage became the law of the land.
- Bisbee, Arizona: Described as a “gay oasis in the desert,” Bisbee is a tiny, artsy town where queer people flock. The city was the first in Arizona to legalize civil unions before national marriage equality and hosts an annual Pride festival.
Media Resources
- High-resolution image of infographic
- High-resolution images of cities
- 2022’s Most LGBTQ-Friendly Cities ranking results
Main Photo Credit: Shutterstock