
Everyone’s Irish on St. Patrick’s Day, but which of the 200 biggest U.S. cities really know how to celebrate the Celtic spirit?
To mark Irish American Heritage Month, LawnStarter ranked 2023’s Most Irish Cities in America.
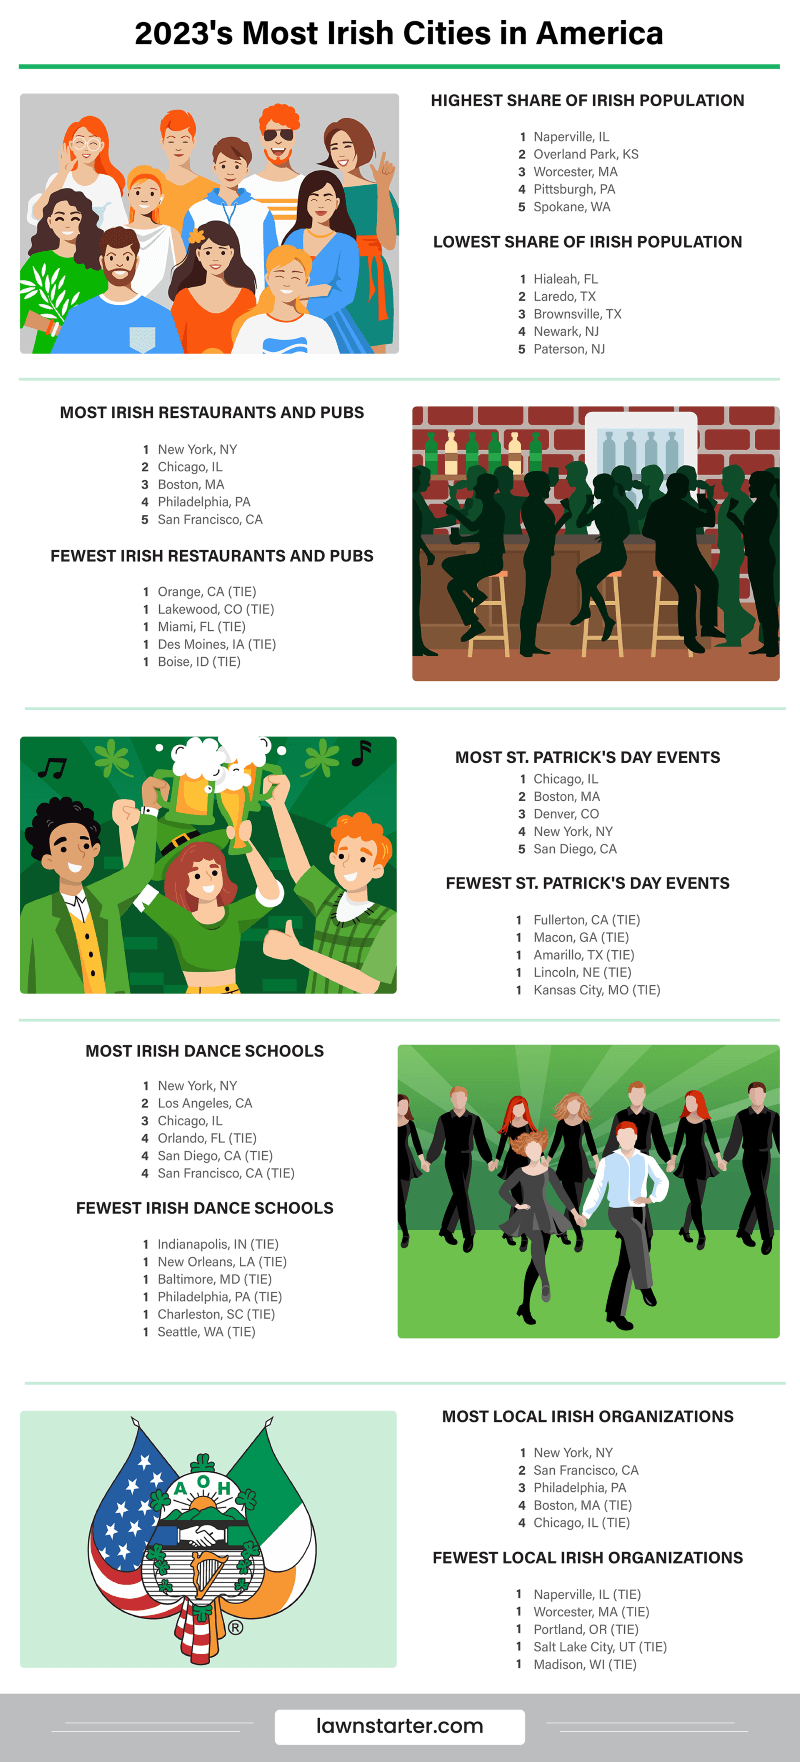
We looked beyond green bloodlines — we also looked at access to Irish pubs, dance schools, and social groups among 10 total indicators of Irishness.
See how much luck your city carries in our ranking below. You’ll also find highlights and lowlights from our data crunching, along with tips on the best ways to learn about Irish culture from Irish historians.
Contents
City Rankings
Which cities are wearing the green?
| Overall Rank (1=Most Irish) | City | State | Overall Score | Community Rank | Food and Drink Rank | Cultural Enrichment Rank | Organizations Rank |
|---|---|---|---|---|---|---|---|
| 1 | New York | NY | 68.37 | 1 | 1 | 2 | 1 |
| 2 | Chicago | IL | 56.4 | 9 | 3 | 1 | 4 |
| 3 | Boston | MA | 42.36 | 2 | 2 | 4 | 4 |
| 4 | Philadelphia | PA | 38.49 | 3 | 8 | 7 | 3 |
| 5 | San Francisco | CA | 34.52 | 65 | 4 | 3 | 2 |
| 6 | Pittsburgh | PA | 31.96 | 5 | 39 | 13 | 10 |
| 7 | Denver | CO | 29.65 | 21 | 14 | 5 | 63 |
| 8 | San Diego | CA | 29.3 | 50 | 10 | 9 | 6 |
| 9 | Seattle | WA | 29.08 | 13 | 5 | 45 | 13 |
| 10 | Omaha | NE | 28 | 6 | 67 | 12 | 149 |
| 11 | Naperville | IL | 27.28 | 4 | 103 | 80 | 58 |
| 12 | Buffalo | NY | 26.97 | 28 | 56 | 14 | 12 |
| 13 | Los Angeles | CA | 25.8 | 87 | 15 | 6 | 7 |
| 14 | Worcester | MA | 25.77 | 8 | 77 | 97 | 58 |
| 15 | Spokane | WA | 25.69 | 10 | 49 | 68 | 70 |
| 16 | Portland | OR | 25.01 | 14 | 17 | 23 | 159 |
| 17 | Washington | DC | 24.87 | 79 | 12 | 8 | 54 |
| 18 | Syracuse | NY | 24.45 | 25 | 56 | 51 | 55 |
| 19 | Colorado Springs | CO | 24.42 | 27 | 38 | 33 | 63 |
| 20 | Minneapolis | MN | 24.34 | 33 | 13 | 26 | 77 |
| 21 | Phoenix | AZ | 24.33 | 35 | 30 | 37 | 57 |
| 22 | Scottsdale | AZ | 24.13 | 18 | 58 | 34 | 82 |
| 23 | Columbus | OH | 23.99 | 16 | 22 | 54 | 128 |
| 24 | Fort Collins | CO | 23.12 | 15 | 89 | 117 | 63 |
| 25 | Louisville | KY | 22.71 | 11 | 32 | 68 | 176 |
| 26 | Overland Park | KS | 22.48 | 7 | 108 | 93 | 178 |
| 27 | Eugene | OR | 22.05 | 12 | 116 | 83 | 159 |
| 28 | Madison | WI | 22.05 | 17 | 103 | 60 | 133 |
| 29 | Austin | TX | 22 | 42 | 47 | 30 | 77 |
| 30 | St. Paul | MN | 21.95 | 44 | 60 | 27 | 77 |
| 31 | St. Petersburg | FL | 21.57 | 30 | 39 | 72 | 82 |
| 32 | Virginia Beach | VA | 21.4 | 26 | 35 | 34 | 178 |
| 33 | Lakewood | CO | 21.39 | 24 | 139 | 127 | 63 |
| 34 | St. Louis | MO | 21.33 | 53 | 11 | 23 | 149 |
| 35 | Huntington Beach | CA | 21.2 | 40 | 71 | 99 | 15 |
| 36 | Boise | ID | 21.17 | 19 | 76 | 52 | 178 |
| 37 | Cape Coral | FL | 20.84 | 31 | 66 | 88 | 82 |
| 38 | Cleveland | OH | 20.62 | 72 | 26 | 17 | 124 |
| 39 | Charleston | SC | 20.53 | 46 | 31 | 50 | 128 |
| 40 | Rochester | NY | 20.39 | 100 | 41 | 31 | 8 |
| 41 | Des Moines | IA | 20.32 | 22 | 131 | 53 | 178 |
| 42 | Raleigh | NC | 20.12 | 76 | 37 | 11 | 149 |
| 43 | Roseville | CA | 20.11 | 55 | 93 | 99 | 15 |
| 44 | Yonkers | NY | 20.1 | 67 | 27 | 124 | 10 |
| 45 | Indianapolis | IN | 20.07 | 49 | 34 | 29 | 159 |
| 46 | Peoria | AZ | 19.92 | 29 | 142 | 131 | 82 |
| 47 | Lexington | KY | 19.7 | 32 | 63 | 55 | 178 |
| 48 | Santa Rosa | CA | 19.64 | 56 | 77 | 124 | 15 |
| 49 | Tacoma | WA | 19.62 | 51 | 52 | 88 | 70 |
| 50 | Wichita | KS | 19.53 | 47 | 160 | 18 | 178 |
| 51 | Joliet | IL | 19.44 | 52 | 127 | 110 | 58 |
| 52 | Reno | NV | 19.35 | 39 | 64 | 67 | 149 |
| 53 | Fort Lauderdale | FL | 19.29 | 78 | 29 | 36 | 77 |
| 54 | Dayton | OH | 19.17 | 57 | 99 | 40 | 133 |
| 55 | Jacksonville | FL | 18.91 | 64 | 85 | 57 | 82 |
| 56 | Knoxville | TN | 18.82 | 54 | 36 | 32 | 178 |
| 57 | Cincinnati | OH | 18.78 | 58 | 59 | 65 | 124 |
| 58 | Tucson | AZ | 18.77 | 73 | 50 | 48 | 82 |
| 59 | Surprise | AZ | 18.77 | 37 | 83 | 159 | 82 |
| 60 | Kansas City | MO | 18.76 | 34 | 71 | 144 | 147 |
| 61 | Lincoln | NE | 18.65 | 23 | 108 | 158 | 159 |
| 62 | Sioux Falls | SD | 18.64 | 38 | 97 | 78 | 159 |
| 63 | Alexandria | VA | 18.43 | 36 | 42 | 86 | 178 |
| 64 | Akron | OH | 18.39 | 45 | 127 | 81 | 133 |
| 65 | Toledo | OH | 18.35 | 41 | 108 | 94 | 133 |
| 66 | Charlotte | NC | 18.23 | 83 | 19 | 27 | 149 |
| 67 | Las Vegas | NV | 18.2 | 85 | 6 | 57 | 149 |
| 68 | Rockford | IL | 18.2 | 74 | 97 | 91 | 58 |
| 69 | Olathe | KS | 18.19 | 20 | 177 | 152 | 178 |
| 70 | Vancouver | WA | 18.11 | 61 | 61 | 132 | 70 |
| 71 | Dallas | TX | 18.1 | 136 | 23 | 10 | 76 |
| 72 | Nashville | TN | 17.96 | 69 | 44 | 21 | 178 |
| 73 | Houston | TX | 17.75 | 130 | 21 | 15 | 69 |
| 74 | Tulsa | OK | 17.63 | 66 | 51 | 61 | 149 |
| 75 | Port St. Lucie | FL | 17.62 | 43 | 108 | 189 | 82 |
| 76 | Oklahoma City | OK | 17.4 | 71 | 71 | 42 | 159 |
| 77 | Tampa | FL | 17.37 | 92 | 9 | 73 | 82 |
| 78 | Sacramento | CA | 17.13 | 120 | 53 | 47 | 15 |
| 79 | Baltimore | MD | 16.99 | 123 | 24 | 16 | 124 |
| 80 | Savannah | GA | 16.9 | 103 | 33 | 25 | 133 |
| 81 | Huntsville | AL | 16.88 | 75 | 117 | 44 | 175 |
| 82 | Henderson | NV | 16.86 | 48 | 131 | 132 | 149 |
| 83 | Fort Wayne | IN | 16.83 | 62 | 62 | 83 | 159 |
| 84 | Albuquerque | NM | 16.74 | 82 | 28 | 65 | 133 |
| 85 | Mesa | AZ | 16.65 | 70 | 93 | 110 | 82 |
| 86 | New Orleans | LA | 16.64 | 132 | 45 | 49 | 13 |
| 87 | Anchorage | AK | 16.63 | 60 | 48 | 99 | 159 |
| 88 | Chandler | AZ | 16.31 | 80 | 77 | 90 | 82 |
| 89 | Milwaukee | WI | 16.31 | 126 | 25 | 22 | 81 |
| 90 | Thornton | CO | 16.21 | 77 | 177 | 155 | 63 |
| 91 | Springfield | MA | 16.13 | 95 | 85 | 124 | 55 |
| 92 | Oceanside | CA | 16.11 | 101 | 81 | 145 | 15 |
| 93 | Tempe | AZ | 16.03 | 86 | 106 | 91 | 82 |
| 94 | Atlanta | GA | 16 | 122 | 16 | 38 | 124 |
| 95 | Springfield | MO | 15.99 | 63 | 71 | 127 | 159 |
| 96 | Orlando | FL | 15.95 | 134 | 7 | 39 | 82 |
| 97 | San Antonio | TX | 15.87 | 127 | 42 | 20 | 82 |
| 98 | Aurora | IL | 15.7 | 106 | 127 | 74 | 58 |
| 99 | Grand Rapids | MI | 15.7 | 91 | 103 | 41 | 159 |
| 100 | Richmond | VA | 15.53 | 105 | 46 | 19 | 176 |
| 101 | Chesapeake | VA | 15.52 | 59 | 142 | 97 | 178 |
| 102 | Fort Worth | TX | 15.45 | 99 | 85 | 68 | 82 |
| 103 | Modesto | CA | 15.44 | 108 | 117 | 117 | 15 |
| 104 | Salem | OR | 15.4 | 68 | 93 | 141 | 149 |
| 105 | Denton | TX | 15.15 | 90 | 160 | 99 | 82 |
| 106 | Santa Clarita | CA | 15.1 | 114 | 108 | 123 | 15 |
| 107 | Aurora | CO | 14.96 | 96 | 117 | 146 | 63 |
| 108 | Norfolk | VA | 14.8 | 94 | 99 | 43 | 178 |
| 109 | Long Beach | CA | 14.76 | 141 | 20 | 74 | 15 |
| 110 | Elk Grove | CA | 14.68 | 116 | 177 | 139 | 15 |
| 111 | Torrance | CA | 14.51 | 115 | 160 | 152 | 15 |
| 112 | San Jose | CA | 14.35 | 144 | 65 | 56 | 15 |
| 113 | Providence | RI | 14.34 | 93 | 68 | 79 | 159 |
| 114 | Tallahassee | FL | 14.12 | 97 | 108 | 132 | 82 |
| 115 | Frisco | TX | 13.97 | 98 | 160 | 132 | 82 |
| 116 | Salt Lake City | UT | 13.96 | 113 | 53 | 63 | 133 |
| 117 | Chattanooga | TN | 13.77 | 88 | 93 | 94 | 178 |
| 118 | Glendale | AZ | 13.72 | 102 | 142 | 146 | 82 |
| 119 | Rancho Cucamonga | CA | 13.68 | 125 | 151 | 177 | 15 |
| 120 | Oakland | CA | 13.56 | 140 | 81 | 108 | 15 |
| 121 | McKinney | TX | 13.52 | 109 | 91 | 110 | 82 |
| 122 | Murfreesboro | TN | 13.51 | 81 | 160 | 110 | 178 |
| 123 | Clarksville | TN | 13.47 | 84 | 117 | 117 | 178 |
| 124 | Waco | TX | 13.42 | 104 | 160 | 117 | 82 |
| 125 | Orange | CA | 13.42 | 128 | 142 | 177 | 15 |
| 126 | Plano | TX | 13.27 | 111 | 139 | 110 | 82 |
| 127 | Warren | MI | 13.06 | 89 | 117 | 168 | 159 |
| 128 | Lubbock | TX | 12.95 | 117 | 160 | 105 | 82 |
| 129 | Bakersfield | CA | 12.92 | 153 | 151 | 63 | 15 |
| 130 | Little Rock | AR | 12.56 | 129 | 77 | 74 | 133 |
| 131 | Escondido | CA | 12.52 | 143 | 108 | 140 | 15 |
| 132 | Kansas City | KS | 12.38 | 112 | 177 | 59 | 178 |
| 133 | Fullerton | CA | 12.35 | 139 | 160 | 189 | 15 |
| 134 | Amarillo | TX | 12.31 | 110 | 151 | 189 | 82 |
| 135 | Bellevue | WA | 12.27 | 131 | 99 | 159 | 70 |
| 136 | Fresno | CA | 12.25 | 146 | 151 | 132 | 15 |
| 137 | Irvine | CA | 12.24 | 142 | 151 | 159 | 15 |
| 138 | Riverside | CA | 12.01 | 147 | 142 | 146 | 15 |
| 139 | Arlington | TX | 11.94 | 133 | 117 | 99 | 82 |
| 140 | Fayetteville | NC | 11.81 | 119 | 142 | 87 | 159 |
| 141 | Pasadena | CA | 11.8 | 148 | 142 | 152 | 15 |
| 142 | Mobile | AL | 11.76 | 107 | 69 | 99 | 178 |
| 143 | Corona | CA | 11.09 | 155 | 142 | 155 | 15 |
| 144 | Greensboro | NC | 11.07 | 137 | 83 | 74 | 159 |
| 145 | Sunnyvale | CA | 11.07 | 157 | 91 | 159 | 15 |
| 146 | Durham | NC | 10.85 | 118 | 85 | 168 | 159 |
| 147 | Carrollton | TX | 10.84 | 135 | 177 | 159 | 82 |
| 148 | Baton Rouge | LA | 10.78 | 150 | 177 | 105 | 70 |
| 149 | Winston-Salem | NC | 10.72 | 121 | 151 | 146 | 159 |
| 150 | Glendale | CA | 10.72 | 164 | 177 | 177 | 9 |
| 151 | Fremont | CA | 10.28 | 161 | 160 | 177 | 15 |
| 152 | Newport News | VA | 10.25 | 124 | 131 | 127 | 178 |
| 153 | Lancaster | CA | 9.94 | 165 | 177 | 146 | 15 |
| 154 | Shreveport | LA | 9.79 | 158 | 177 | 132 | 70 |
| 155 | Anaheim | CA | 9.75 | 169 | 131 | 141 | 15 |
| 156 | Garland | TX | 9.73 | 145 | 177 | 168 | 82 |
| 157 | Jersey City | NJ | 9.71 | 151 | 69 | 117 | 128 |
| 158 | Columbus | GA | 9.54 | 149 | 117 | 117 | 133 |
| 159 | Hollywood | FL | 9.49 | 159 | 89 | 115 | 82 |
| 160 | Corpus Christi | TX | 9.43 | 152 | 106 | 146 | 82 |
| 161 | Hampton | VA | 9.35 | 138 | 142 | 105 | 178 |
| 162 | Memphis | TN | 9.08 | 156 | 55 | 62 | 178 |
| 163 | Stockton | CA | 9.07 | 174 | 151 | 159 | 15 |
| 164 | Garden Grove | CA | 9.04 | 173 | 151 | 168 | 15 |
| 165 | Hayward | CA | 9.02 | 175 | 177 | 159 | 15 |
| 166 | Chula Vista | CA | 8.42 | 177 | 160 | 189 | 15 |
| 167 | San Bernardino | CA | 8.14 | 182 | 177 | 177 | 15 |
| 168 | Ontario | CA | 8.09 | 183 | 177 | 168 | 15 |
| 169 | Macon | GA | 8.05 | 154 | 160 | 189 | 133 |
| 170 | Augusta | GA | 8 | 167 | 151 | 82 | 133 |
| 170 | Mesquite | TX | 8 | 163 | 177 | 177 | 82 |
| 172 | Killeen | TX | 7.95 | 162 | 177 | 189 | 82 |
| 173 | Honolulu | HI | 7.93 | 172 | 18 | 115 | 133 |
| 174 | El Paso | TX | 7.7 | 179 | 139 | 83 | 82 |
| 175 | Palmdale | CA | 7.68 | 184 | 177 | 189 | 15 |
| 176 | Pembroke Pines | FL | 7.66 | 166 | 117 | 168 | 82 |
| 177 | North Las Vegas | NV | 7.54 | 160 | 135 | 168 | 149 |
| 178 | Fontana | CA | 7.51 | 185 | 177 | 189 | 15 |
| 179 | Oxnard | CA | 7.25 | 188 | 125 | 159 | 15 |
| 180 | Santa Ana | CA | 7.04 | 193 | 160 | 127 | 15 |
| 181 | Pasadena | TX | 6.85 | 171 | 177 | 189 | 82 |
| 182 | Detroit | MI | 6.84 | 191 | 71 | 46 | 147 |
| 183 | Moreno Valley | CA | 6.75 | 189 | 160 | 189 | 15 |
| 184 | Irving | TX | 6.72 | 176 | 160 | 155 | 82 |
| 184 | Salinas | CA | 6.72 | 190 | 177 | 177 | 15 |
| 186 | Grand Prairie | TX | 6.69 | 180 | 160 | 141 | 82 |
| 187 | Pomona | CA | 6.59 | 192 | 177 | 159 | 15 |
| 188 | Bridgeport | CT | 6.52 | 178 | 127 | 109 | 133 |
| 189 | West Valley City | UT | 6.2 | 170 | 160 | 189 | 133 |
| 190 | Miami | FL | 5.87 | 194 | 125 | 71 | 82 |
| 191 | Montgomery | AL | 5.66 | 168 | 177 | 132 | 178 |
| 192 | Birmingham | AL | 5.35 | 181 | 108 | 94 | 178 |
| 193 | McAllen | TX | 5.1 | 187 | 135 | 168 | 82 |
| 194 | Miramar | FL | 3.88 | 195 | 177 | 177 | 82 |
| 195 | Jackson | MS | 3.04 | 186 | 135 | 177 | 178 |
| 196 | Paterson | NJ | 2.8 | 196 | 177 | 168 | 128 |
| 197 | Newark | NJ | 2.78 | 197 | 102 | 177 | 128 |
| 198 | Brownsville | TX | 2.73 | 199 | 135 | 177 | 82 |
| 199 | Laredo | TX | 2.57 | 198 | 160 | 189 | 82 |
| 200 | Hialeah | FL | 2.18 | 200 | 177 | 177 | 82 |
Highlights and Lowlights
It’s Paddy Time in New York
The Big (Green) Apple is our Most Irish City this year, leaving our previous gold medalist, Boston, green with envy.
How did New York riverdance its way to the top spot? The city dominated three out of four categories and finished just behind Chicago in Cultural Enrichment — despite Irish Americans making up a tiny fraction, 4.4%, of the city’s total population.
By sheer number, though, New York is home to the most Irish Americans, over 386,000 as of 2021, nearly double the group’s size in Chicago.
Generally, the larger a cultural group, the higher the demand for culturally specific amenities in their area, such as Irish pubs, Irish social groups, and Irish dance schools, all of which are most abundant in New York City.
An Unlikely Paddy Destination
While the biggest U.S. cities traditionally put on the largest and most popular St. Patrick’s Day parades, there’s one other city in the Heartland that can indulge the party animal in you.
No, it’s not Chicago, Minneapolis, or St. Louis.
At No. 50 overall, Wichita, Kansas, is a pot of gold when it comes to St. Pat’s celebrations, ranking No. 9 in this particular metric — even above more Irish cities like Philadelphia, Washington, and Portland, Oregon.
This might come as a surprise, but Kansas’ connection to Ireland stretches back centuries. According to the Kansas Historical Society, most immigrants to Kansas arrived from Ireland in 1870. And the Kansas Jayhawk? The men’s basketball team mascot traces its roots to Irish folklore.
Low in Green Blood, High in Green Spirit
The cities with the smallest Irish American populations — both in number and proportion — unsurprisingly landed at the bottom of our ranking. They include cities like Hialeah, Florida, in last place and Laredo, Texas, just ahead of it.
Paterson, New Jersey (No. 196), counts among them, too. The Irish were once the dominant culture here — its Dublin neighborhood still exists — but waves of new immigrants have transformed the face of the city.
However, the lack of Irish residents in these cities today doesn’t mean they aren’t welcome. You’ll find Irish pubs, for example, in Newark, New Jersey (No. 197), Jackson, Mississippi (No. 195), and Birmingham, Alabama (No. 192).
In Miramar, Florida (No. 194), and McAllen, Texas (No. 193), you have an excuse to don your greenest outfit — each city hosts St. Paddy’s celebrations.
Ask The Experts
We all could think a little more “green” by understanding one of the biggest ethnic groups in America and its traditions.
To help our readers with their “Irishification,” LawnStarter reached out to researchers who study Irish culture. See what they had to say below.
- What are the three best ways to learn about Irish culture?
- What’s the best way to celebrate St. Patrick’s Day this year?
- What Irish cultural practices have had the biggest influence on modern U.S. culture?


What are the three best ways to learn about Irish culture?
1. Depending on your city, there may be an Irish cultural center or a branch of the Ancient Order of Hibernians. Cultural centers are great ways to learn about Irish music, arts, dancing, and sports. Many of them also offer Irish language classes.
There might even be an annual Irish festival in your community.
2. Even if your city doesn’t have an Irish cultural center, it probably has an Irish pub. Irish pubs started appearing in the U.S. in the 19th century during a huge wave of Irish immigration. Lots of pubs put on traditional Irish music sessions, so that’s a great way to experience Irish culture.
3. You can also learn about Irish culture without leaving your home. You can start learning the Irish language (Gaelic) using apps like Duolingo, and there are plenty of online communities where people connect to learn the Irish language.
Increasingly, many Irish cultural events are also available online. The Irish American Heritage Museum in Albany, New York, now livestreams most of its events via its Facebook page.
What’s the best way to celebrate St Patrick’s Day this year?
Many cities are reinstating their annual St. Patrick’s Day parades this year, so attending one of those is always a good way to celebrate. Heading to an Irish pub for a pint of Guinness is always a great way to celebrate.
The traditional Irish-American celebration is to make corned beef and cabbage. This isn’t a common celebration in Ireland. Instead, this meal became popular with 19th-century Irish immigrants. But for many Irish American families, a St. Patrick’s Day dinner of corned beef and cabbage, along with Irish soda bread, is a cherished tradition.
So, you can always choose to stay in with a good meal and try your hand at baking your own soda bread. Soda bread is quick bread that was being made in Ireland as far back as 1836.
What Irish cultural practices have had the biggest influence on modern U.S. culture?
The Irish have been coming to the United States since before we were the United States. But the 19th century saw a huge wave of immigration beginning with the Great Famine in Ireland.
It was this wave of emigration that transformed many American cities, and chances are most of the cities on this list began to be seen as Irish cities during that era. This wave of Irish immigrants helped to build massive infrastructure projects such as the Erie Canal or the transcontinental railway.
There are tons of lingering effects from the ubiquity of Irish surnames to the presence of Irish pubs everywhere. Thirty-one and a half million Americans claim some Irish descent.
One of the biggest ways the effects of this immigration lingers is through our St. Patrick’s Day celebrations. Back in the 19th century, Irish immigrants faced considerable discrimination, but these days everyone is a little bit Irish on St. Patrick’s Day.
What are the three best ways to learn about Irish culture?
1. Visit Ireland. May to September is an ideal timeframe to plan a visit, with May to June and September offering good possibilities of fine weather, shorter queues at popular historical sites and attractions, cheaper fares and accommodations, and greater choice in flight options and hotels, B&Bs, and Airbnb availability.
Travel around the coast, across the midlands, around Ulster — the country is travel-friendly in terms of public transportation or car hire, and you will learn so much about Irish culture.
2. Read Irish history, fiction, and poetry. The breadth of focus stretches from studies of monastic centers of learning in the Middle Ages to post Celtic-Tiger Ireland today, and the wealth of historical and literary offerings will engage you deeply with the national culture.
Irish literature is world-renowned, from canonical writers and poets such as Swift, Joyce, Yeats, Wilde, Shaw, and Heaney to newer stars like Sally Rooney and Donal Ryan — reading Irish authors will educate you on Ireland in deep and satisfying ways.
3. Identify a cultural theme to explore and pursue it by means of online, film, and published sources. Such themes might include Irish folklore, traditional crafts, pilgrimage sites, or sports played in Ireland. Your selected focus will draw you in to an Irish cultural cornerstone and assuredly educate you on what it means to be Irish.
What’s the best way to celebrate St. Patrick’s Day this year?
Watch one of the recent historical or cultural documentaries on a selected aspect of Ireland (for example, “The Hunger, The Story of the Irish Famine of the 1840s” or “The Burren: Heart of Stone”). And offer a greeting for the big day in Irish: La Fhéile Phadraig shona dhuitse!
What Irish cultural practices have had the biggest influence on modern U.S. culture?
The legacy of Irish arrival and settlement in America is a rich incorporation of a broad spectrum of influences and effects.
From historic neighborhoods where Irish Famine refugees settled, such as the Five Points and Bowery in New York or the old North End in Boston, to the ethnic foundations they established in spheres of politics, education, and business, the Irish imprint is deep and enduring.
The range of Irish Studies academic programs, Irish-themed dramatic-arts outlets, Irish clothing and crafts, and general interest in all things Irish across the United States continues to expand, and the reach is extraordinary.
And celebration of immigrant Irish achievement in these forms has become as much a part of the deeper meaning of St. Patrick’s Day as the more visible forms of engagement we witness on the day.
Behind the Ranking
For each of the 200 biggest U.S. cities, we gathered publicly available data on the factors listed in the table below.
We then grouped those factors into four categories: Community, Food and Drink, Cultural Enrichment, and Organizations.
Next, we calculated weighted scores for each city in each category.
Finally, we averaged the scores for each city across all categories.
The city that earned the highest average score was ranked “Most Irish” (No. 1), while the city with the lowest was ranked “Least Irish” (No. 200).
Notes:
- The “Least Irish” among individual factors may not be No. 200 due to ties among cities.
- “Local” and “State Irish organizations” include, among others, Irish cultural and heritage centers and clubs; museums; dance schools; libraries; immigration, legal, and welfare support centers; and networking associations.
| Metric | Weighting | Lowest Value | Highest Value | Best |
|---|---|---|---|---|
| Community | ||||
| Irish Population | 5 | 413 | 386,020 | Highest |
| Share of Irish Population | 5 | 0.18% | 15.13% | Highest |
| Food and Drink | ||||
| Number of Irish Restaurants and Pubs | 3 | 0 | 124 | Highest |
| Number of Fish and Chips Vendors | 0.5 | 0 | 101 | |
| Cultural Enrichment | ||||
| Number of St. Patrick's Day Events | 5 | 0 | 222 | Highest |
| Number of Irish Cultural Groups | 1 | 0 | 12 | Highest |
| Number of Irish Dance Schools | 1 | 0 | 14 | Highest |
| Number of Irish Landmarks | 0.5 | 0 | 4 | Highest |
| Organizations | ||||
| Number of Local Irish Organizations | 2 | 0 | 26 | Highest |
| Number of State Irish Organizations | 1 | 0 | 6 | Highest |
Sources: Coalition of Irish Immigration Centers, Global Irish, Google Events, The Ireland Funds, Irish-American Heritage Museum, Irish Network USA, Mark Holan’s Irish-American Blog, Meetup, Transceltic, TripAdvisor, and U.S. Census Bureau
Local Tips
Finding corned beef and green beer throughout the year can be like searching for a four-leaf clover. Not now.
For those who claim Irish ancestry — and everyone else — a green March Madness is already in full swing. Check out the slideshow below to help you plan your St. Patrick’s Day itinerary in our top five Most Irish Cities in America.
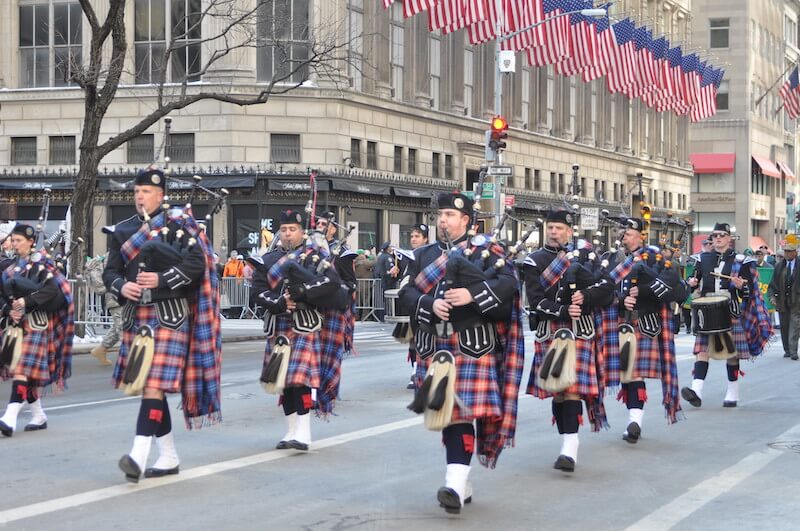
Crowd-averse? Buy an all-day pass for $30 to “40 Shades of Green,” a slightly more intimate, six-hour event featuring 50 music and dance acts at the New York Irish Center. Don’t forget to stop by St. Patrick’s Cathedral, a bucket-list landmark for any architecture-obsessed tourist but especially Irish Catholics.
Photo Credit: New York National Guard / Flickr / CC BY-ND 2.0

The McNulty School of Irish Dance traces its humble beginnings to the Windy City, more specifically its suburb Naperville, which has the highest share of Irish residents. If you missed their March 5 performance, you can book the dancers for your own private event or enroll your kids in the McNulty program to keep your Irish heritage alive.
Photo Credit: goatling (cropped) / Flickr / CC BY-SA 2.0
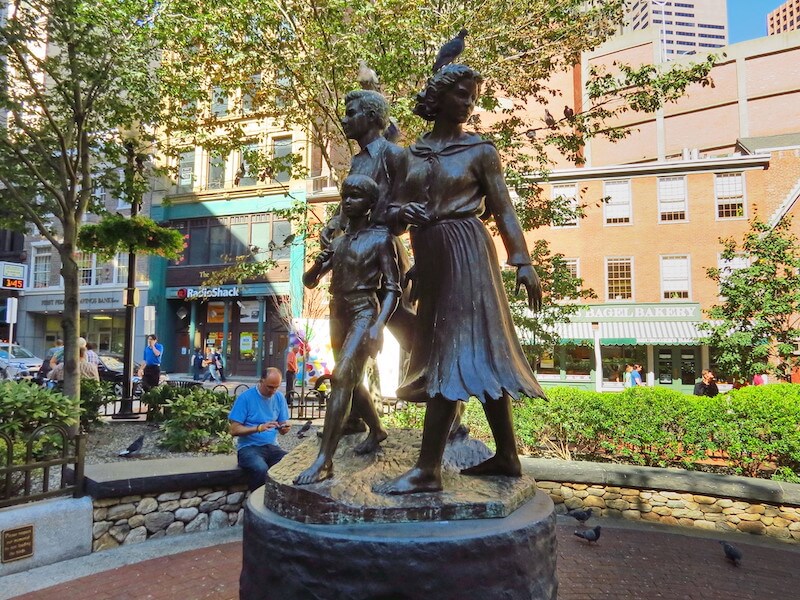
When you’re not downing a pint of Guinness, explore dozens of the city’s Irish-themed sites and landmarks through a three-mile, self-guided tour on the Irish Heritage Trail.
Photo Credit: Robert Linsdell / Flickr / CC BY 2.0
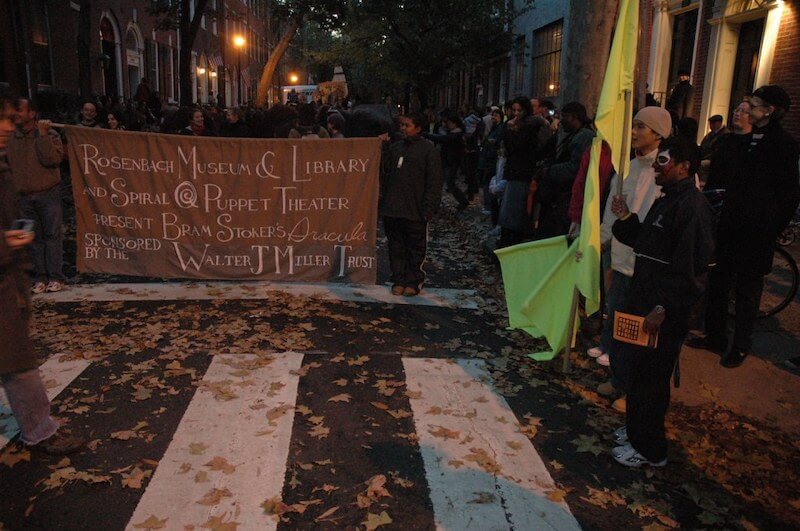
Lit fan? Experience history at your fingertips — literally — by visiting The Rosenbach Museum & Library, where you can touch over 100 pages of Irish author Bram Stoker’s notes and outlines on his famous vampire novel, “Dracula.”
Photo Credit: Pablo Virgo / Flickr / CC BY-SA 2.0
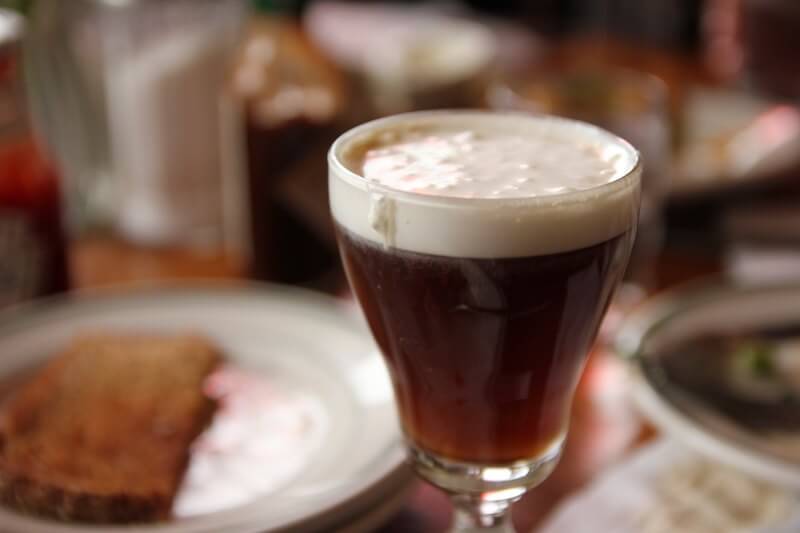
Nostalgic expats must include The Buena Vista in their itinerary. Here, you can grab an Irish Coffee, recreated from the original version invented at the Shannon Airport in Ireland. Once you’ve filled up on caffeine and rashers, head over to the United Irish Cultural Center of San Francisco for a deep dive into Irish history and culture — or to score some Irish goodies.
Photo Credit: isuperwang / Flickr / CC BY-SA 2.0
You don’t need the luck of the Irish to keep your grass brilliantly green, so stop looking for that four-leaf clover and hire a local LawnStarter pro instead.
Main Photo Credit: Shutterstock