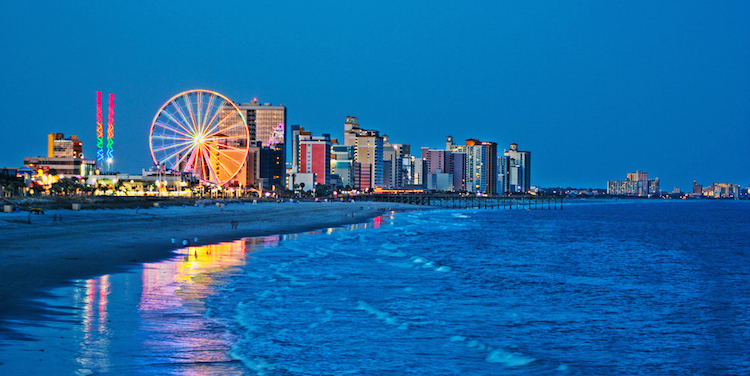
In Myrtle Beach, SC, the beaches that make up the “Grand Strand” stretch for 60 miles. In 2014, more than 17 million visitors flocked to the region to soak up the sun and surf.
These days, tourists aren’t the only ones flocking to the Myrtle Beach metro area. From 2010 to 2014, the area’s population soared nearly 11 percent — making it one of the country’s fastest-growing metro areas during that span. As you’d suspect, the region’s economy is growing along with its headcount.
“New business owners looking to get their company off the ground or established firms that are planning to expand can find everything they need for success here in the Myrtle Beach area.”
— Brad Dean, president and CEO, Myrtle Beach Area Chamber of Commerce
Because Myrtle Beach is making population and economic waves, it leads LawnStarter’s new “Growing Like a Weed” ranking of U.S. metro areas. The phrase “growing like a weed” refers to the rapid growth of a child, a company or, in this case, a metro area.
To come up with the list, we first looked at metro areas with 300,000 to 1 million residents in 2010 whose populations had climbed at least 6 percent from 2010 to 2014. We then examined three other factors: economic growth, job growth and patent growth. Once we evenly weighted those four sets of data, the “Growing Like a Weed” ranking was born.

‘Emerging Hub’
While the Myrtle Beach region is known primarily as a tourist destination — pumping $6.3 billion into the local economy and responsible for an estimated 73,500 jobs — it’s also gaining notice as a business hub. Earlier this year, personal finance website NerdWallet recognized Myrtle Beach as one of the top three best places to start a business in South Carolina.
Brad Dean, president and CEO of the Myrtle Beach Area Chamber of Commerce, and Fred Richardson, chairman of the Myrtle Beach Regional Economic Development Corp., cite low taxes, affordable health care, good schools, a great quality of life and a skilled workforce as some of the region’s economic draws.
Richardson’s group bills the Myrtle Beach area as an “emerging hub for global business.” Companies around the world have begun to view the region as “a competitive location for business,” he says.
“New business owners looking to get their company off the ground or established firms that are planning to expand can find everything they need for success here in the Myrtle Beach area,” Dean says.
Here’s how Myrtle Beach and its “Growing Like a Weed” rivals stack up in our ranking.
1. Myrtle Beach, SC

Population growth 2010-14: 10.90%
Economic growth 2014-21 (projected annualized rate): 5.70%
Job growth 2014-15 (projected): 3.30%
Growth in patents for inventions 2000-13 (annualized rate): 32.02%
Weighted percentage: 12.98%
2. Provo, UT

Population growth 2010-14: 8.50%
Economic growth 2014-21 (projected annualized rate): 6.70%
Job growth 2014-15 (projected): 3.40%
Growth in patents for inventions 2000-13 (annualized rate): 26.89%
Weighted percentage: 11.37%
3. Naples, FL

Population growth 2010-14: 8.50%
Economic growth 2014-21 (projected annualized rate): 6.40%
Job growth 2014-15 (projected): 4.00%
Growth in patents for inventions 2000-13 (annualized rate): 24.13%
Weighted percentage: 10.76%
4. Fort Myers, FL

Flickr/The Beaches of Fort Myers & Sanibel
Population growth 2010-14: 9.80%
Economic growth 2014-21 (projected annualized rate): 5.90%
Job growth 2014-15 (projected): 3.80%
Growth in patents for inventions 2000-13 (annualized rate): 22.95%
Weighted percentage: 10.61%
5. Des Moines, IA

Population growth 2010-14: 7.40%
Economic growth 2014-21 (projected annualized rate): 4.60%
Job growth 2014-15 (projected): 1.90%
Growth in patents for inventions 2000-13 (annualized rate): 26.31%
Weighted percentage: 10.05%
6. Durham-Chapel Hill, NC

Population growth 2010-14: 7.10%
Economic growth 2014-21 (projected annualized rate): 5.60%
Job growth 2014-15 (projected): 2.60%
Growth in patents for inventions 2000-13 (annualized rate): 24.51%
Weighted percentage: 9.95%
Did you know we service Raleigh, including Chapel Hill and Durham? Get a quote in seconds and complete your order in minutes.
7. Sarasota-Bradenton, FL

Flickr/Robert S. Donovan
Population growth 2010-14: 6.60%
Economic growth 2014-21 (projected annualized rate): 5.20%
Job growth 2014-15 (projected): 3.30%
Growth in patents for inventions 2000-13 (annualized rate): 23.13%
Weighted percentage: 9.56%
8. Savannah, GA

Population growth 2010-14: 7.20%
Economic growth 2014-21 (projected annualized rate): 4.10%
Job growth 2014-15 (projected): 2.50%
Growth in patents for inventions 2000-13 (annualized rate): 24.35%
Weighted percentage: 9.54%
9. Charleston, SC

Population growth 2010-14: 9.50%
Economic growth 2014-21 (projected annualized rate): 5.20%
Job growth 2014-15 (projected): 2.60%
Growth in patents for inventions 2000-13 (annualized rate): 20.19%
Weighted percentage: 9.37%
10. Boise, ID

Population growth 2010-14: 7.80%
Economic growth 2014-21 (projected annualized rate): 5.20%
Job growth 2014-15 (projected): 2.20%
Growth in patents for inventions 2000-13 (annualized rate): 21.18%
Weighted percentage: 9.10%
11. Fayetteville, AR

Population growth 2010-14: 8.30%
Economic growth 2014-21 (projected annualized rate): 5.80%
Job growth 2014-15 (projected): 1.40%
Growth in patents for inventions 2000-13 (annualized rate): 20.41%
Weighted percentage: 8.98%
12. Colorado Springs, CO

Colorado Springs Convention & Visitors Bureau
Population growth 2010-14: 6.40%
Economic growth 2014-21 (projected annualized rate): 5.10%
Job growth 2014-15 (projected): 2.50%
Growth in patents for inventions 2000-13 (annualized rate): 21.14%
Weighted percentage: 8.79%
13. McAllen, TX

Population growth 2010-14: 7.30%
Economic growth 2014-21 (projected annualized rate): 5.60%
Job growth 2014-15 (projected): 2.80%
Growth in patents for inventions 2000-13 (annualized rate): 13.97%
Weighted percentage: 7.42%
Sources
http://factfinder.census.gov/faces/tableservices/jsf/pages/productview.xhtml?src=bkmk
http://usmayors.org/metroeconomies/0615/report.pdf
http://www.usmayors.org/83rdWinterMeeting/media/012115-release-MetroEconomies.pdf
http://www.uspto.gov/web/offices/ac/ido/oeip/taf/cls_cbsa/allcbsa_gd.htm
Related Posts
 Pigskin and Population: America’s 15 Fastest-Growing College Football Towns
- The 13 Big Metro Areas With the Most Trick-or-Treaters
- Googling for Grass: The 9 Metro Areas That Really Loved ‘Lawn Care’ in 2015
- Which Big Texas City Will Need 150% More Water by 2040?
- A Prep Guide to Winter Lawn Care for Tampa, FL
- The Top 5 Most Majestic Lawns in Nashville, TN