Fall Leaf Burden Index 2026: Which U.S. Metros Face the Heaviest Cleanup?
LawnStarter research · 2026 edition
The Fall Leaf Burden Index: Which U.S. Metros Face the Heaviest Cleanup?
Charleston, West Virginia, has the heaviest fall leaf burden of any U.S. metro we measured. Not Atlanta, the City in a Forest, and not Charlotte, the City of Trees.
Here’s why: LawnStarter scored 383 metropolitan areas on how much deciduous forest surrounds them and how much yard-and-housing exposure they have, then estimated when leaf cleanup peaks in each one. Type your city to see where it lands.
And no matter where you are, here’s what to do with all those leaves: “Before you bag them up and haul them away, think about how you can reuse them right there in your landscape,” says Erika Lyon, educator, Agriculture & Natural Resources, with the Ohio State University Extension.
How to read this: “Metro” refers to one of the 383 metropolitan statistical areas (MSAs) in this analysis. The Leaf Burden Index is a relative 0–100 score for comparing metros; it is not a count of leaves, bags, or cleanup costs.
#1 Charleston, WVheaviest fall leaf burden
84% vs 6%deciduous forest: Charleston vs the typical metro
By Alice Onofrei · Published · Data: public sources, 2024–2026 · How we calculated it
Key findings
What the 2026 Fall Leaf Burden Index shows
The short answer
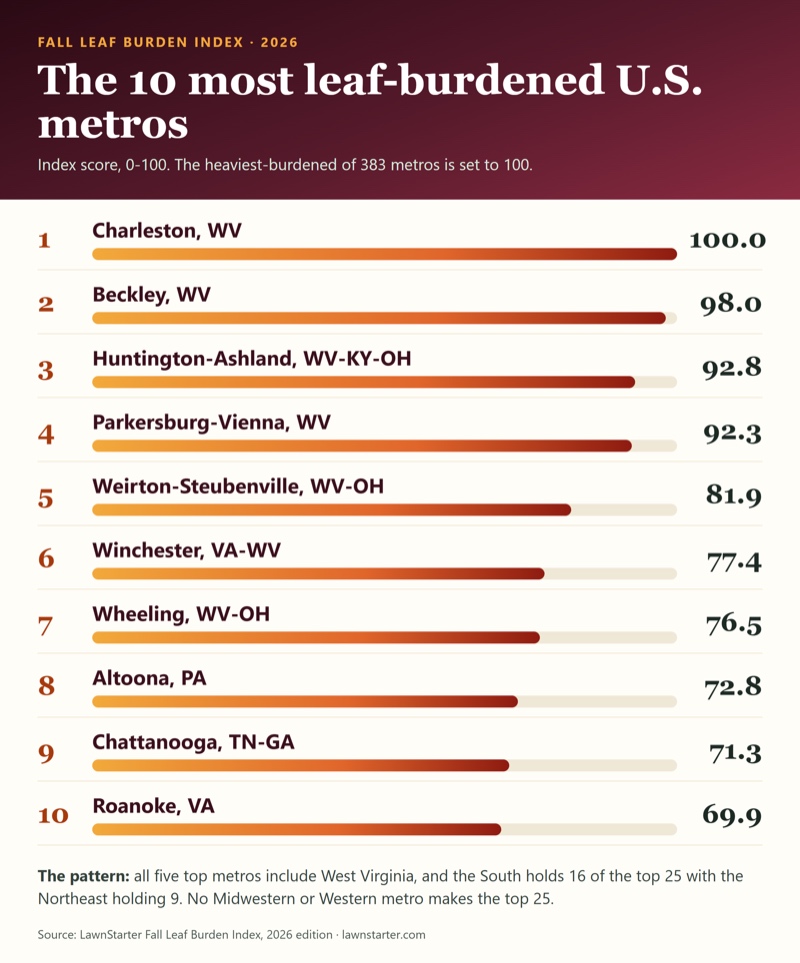
Charleston, WV has the heaviest fall leaf burden of any U.S. metro we measured (index 100), ahead of Beckley, WV (98.0) and Huntington-Ashland, WV-KY-OH (92.8). The top five metros all include West Virginia, and all 7 metros whose first-listed state is West Virginia are in the top 50.
The South has 16 of the 25 most leaf-burdened metros and the Northeast has 9. No Midwestern or Western metro makes the top 25, and 28 of the 50 least-burdened metros are in the West.
Deciduous forest cover is the heaviest-weighted input and is strongly associated with rank (rank correlation 0.78). Charleston, WV is 84% deciduous forest; the typical (median) metro is 6%.
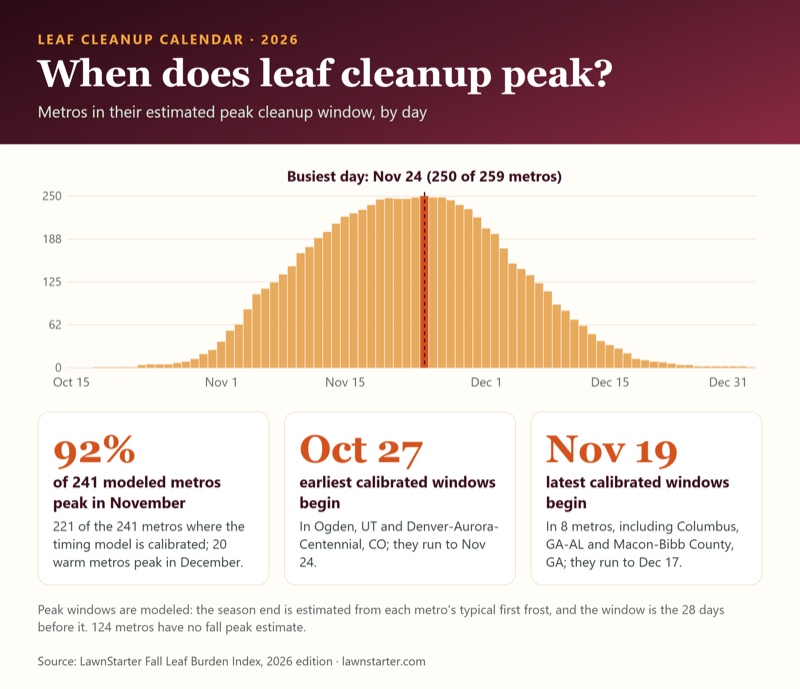
In our timing model, leaf cleanup peaks in November in 221 of the 241 metros (92%) where the model is calibrated, and in December in the 20 warmest (peak month = the month at the midpoint of the 28-day peak window). Among those metros the earliest peak windows begin Oct 27 and the latest begin Nov 19. The 124 metros with no fall peak estimate (mostly evergreen, low-canopy or frost-free) are not counted, and on the 46 metros used to fit it the model picks the right peak month 89% of the time versus 83% for guessing November everywhere, a modest edge.
Big metros rank mid-table or low. Among the ten most populous, Atlanta-Sandy Springs-Roswell, GA ranks highest (#52) and Phoenix-Mesa-Chandler, AZ lowest (#375).
Few people live in the most leaf-burdened metros. The 25 most leaf-burdened metros hold 9.4 million people, 3.2% of the 293.8 million living in the 383 metros scored.
How to interpret the results: This is a relative comparison among metros. Western and Pacific Northwest scores are directional because the leaf-supply measures may miss deciduous trees planted along streets and in yards. Peak windows are modeled estimates, and the satellite leaf-drop measure has important limitations. Full details appear in the limitations section below.
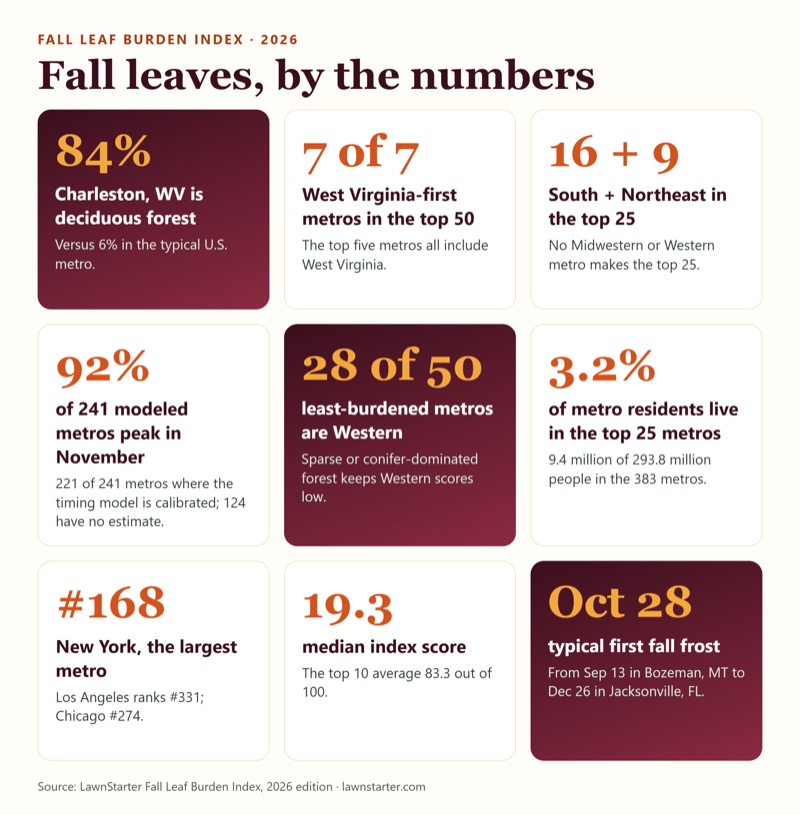
The numbers behind the headlines
84%
Charleston, WV is mostly deciduous forest
Deciduous forest covers 84.3% of Charleston’s land, compared with 6.0% in the typical metro.
7 of 7
West Virginia metros in the top 50
Every metro whose first-listed state is West Virginia ranks in the top 50. Pennsylvania has 6 of 16; Connecticut has 4 of 5.
16 + 9
South and Northeast hold the top 25
The South has 16 of the 25 heaviest metros and the Northeast has 9. The Midwest and West have none.
92%
of 241 modeled metros peak in November
In our timing model, cleanup peaks in November in 221 of the 241 metros where the model is calibrated, and in December in 20. 124 metros have no fall peak estimate.
28 of 50
least-burdened metros are Western
28 of the 50 lowest-scoring metros are in the West, where forests are sparse or conifer-dominated.
3.2%
of metro residents live in the top 25 metros
The 25 most leaf-burdened metros hold 9.4 million of 293.8 million people in the 383 metros (Census 2025 estimates).
#52 to #375
the ten biggest metros, ranked
Atlanta-Sandy Springs-Roswell, GA ranks #52; Phoenix-Mesa-Chandler, AZ ranks #375. New York, the largest metro, is #168.
124 vs 53 days
leaf-drop season, longest to shortest
The satellite-measured leaf-drop window is longest in Auburn-Opelika, Alabama, and Montgomery, Alabama (nearly tied), and shortest in Champaign-Urbana, Illinois (a median 95 days among the 345 metros with reliable data). This measure uses one year of satellite observations, so interpret it cautiously.
Oct 28–29
typical first fall frost
Among the 358 metros with a typical frost, the median metro's first frost (first day with a low below freezing, or 32 °F; 1991–2020 gridded normal) falls on Oct 28–29. It ranges from Sep 13 in Bozeman, MT to Dec 26 in Jacksonville, FL; 25 metros have no typical frost.
25.0 inches
wettest fall, versus the driest
Mount Vernon-Anacortes, WA averages 25.0 inches of September-November precipitation across the metro (1991–2020 normal); El Centro, CA averages 0.6 inches. Median metro: 10.2 inches. These are metro-wide gridded averages, not single weather-station readings. The metro covers Skagit County, which reaches into the Cascade Range.
82%
of homes are detached in the most yard-heavy metro
Wildwood-The Villages, FL has the highest share of detached single-family homes (82.3%); New York-Newark-Jersey City, NY-NJ has the lowest (34.9%). Median metro: 66.9%.
19.3
median Leaf Burden Index score
The typical metro scores 19.3 out of 100, while the top 10 average 83.3. A total of 78 metros score below 5; 47 score 50 or higher.
The ranking
Fall Leaf Burden Index 2026: all 383 metros ranked
Scores run from 0 to 100, with the heaviest-burdened metro set to 100. A higher score indicates a heavier modeled leaf-cleanup burden, based on deciduous forest, yard-and-housing exposure, and cleanup conditions. Select any metro to open its card.
The 10 most leaf-burdened U.S. metros
1
100.0
2
98.0
3
92.8
4
92.3
5
81.9
6
77.4
7
76.5
8
72.8
9
71.3
10
69.9
Search and sort all 383 metros
Showing 383 of 383 metros
Fall Leaf Burden Index 2026 for 383 U.S. metropolitan areas. Regions are U.S. Census Bureau regions, assigned by the first state in the metro's name. Scores are shown to one decimal but metros are ranked on unrounded scores, so neighbors can show the same score. Peak windows are estimates; “extrapolated” means the metro is outside the range used to fit the model.
1
South
100.0
84.3%
70%
Oct 29
Nov 10 – Dec 8
2
South
98.0
75.7%
74%
Oct 24
Nov 7 – Dec 5
3
South
92.8
74.9%
71%
Oct 28
Nov 9 – Dec 7
4
South
92.3
68.8%
74%
Oct 27
Nov 9 – Dec 7
5
South
81.9
59.5%
77%
Oct 30
Nov 10 – Dec 8
6
South
77.4
58.0%
74%
Oct 20
Nov 5 – Dec 3
7
South
76.5
58.0%
74%
Oct 25
Nov 8 – Dec 6
8
Northeast
72.8
60.4%
71%
Oct 17
Nov 4 – Dec 2
9
South
71.3
48.5%
70%
Nov 03
Nov 12 – Dec 10
10
South
69.9
51.2%
71%
Oct 27
Nov 9 – Dec 7
11
South
68.3
51.4%
70%
Oct 27
Nov 9 – Dec 7
12
South
68.1
47.9%
70%
Oct 31
Nov 11 – Dec 9
13
South
67.5
52.0%
66%
Oct 25
Nov 8 – Dec 6
14
Northeast
67.1
49.2%
74%
Oct 13
Nov 2 – Nov 30
15
Northeast
66.9
53.3%
68%
Oct 18
Nov 5 – Dec 3
16
South
66.4
39.9%
72%
Nov 10
Nov 16 – Dec 14
17
Northeast
62.5
49.4%
68%
Oct 20
Nov 5 – Dec 3
18
Northeast
61.8
52.1%
65%
Oct 14
Nov 3 – Dec 1
19
South
61.2
47.0%
65%
Oct 30
Nov 10 – Dec 8
20
South
60.7
67.6%
56%
Oct 19
Nov 5 – Dec 3
21
Northeast
60.3
50.3%
61%
Oct 22
Nov 6 – Dec 4
22
Northeast
60.3
47.7%
69%
Oct 13
Nov 2 – Nov 30
23
South
59.2
50.0%
69%
Oct 29
Nov 10 – Dec 8
24
Northeast
58.8
43.9%
59%
Oct 19
Nov 5 – Dec 3
25
Northeast
58.0
42.9%
66%
Oct 07
Oct 30 – Nov 27
26
South
57.3
38.4%
76%
Oct 23
Nov 7 – Dec 5
27
South
57.0
31.5%
79%
Nov 07
Nov 14 – Dec 12
28
Northeast
56.1
37.5%
73%
Oct 08
Oct 31 – Nov 28
29
South
56.1
33.7%
70%
Nov 07
Nov 14 – Dec 12
30
South
55.8
40.0%
69%
Oct 29
Nov 10 – Dec 8
31
South
55.5
41.2%
72%
Nov 04
Nov 13 – Dec 11
32
Northeast
54.9
39.0%
56%
Oct 23
Nov 7 – Dec 5
33
South
54.8
30.9%
73%
Nov 04
Nov 13 – Dec 11
34
Northeast
54.7
48.2%
62%
Oct 19
Nov 5 – Dec 3
35
Northeast
54.5
42.0%
59%
Oct 20
Nov 5 – Dec 3
36
South
54.4
33.0%
70%
Oct 31
Nov 11 – Dec 9
37
South
54.0
45.0%
66%
Oct 24
Nov 7 – Dec 5
38
Northeast
54.0
43.1%
68%
Oct 11
Nov 1 – Nov 29
39
South
53.6
45.3%
70%
Nov 01
Nov 11 – Dec 9
40
South
53.4
40.2%
65%
Oct 25
Nov 8 – Dec 6
41
South
52.4
47.2%
62%
Oct 21
Nov 6 – Dec 4
42
South
51.7
36.0%
70%
Nov 02
Nov 12 – Dec 10
43
South
51.6
25.6%
70%
Nov 08
Nov 15 – Dec 13
44
Northeast
51.1
43.5%
65%
Oct 07
Oct 30 – Nov 27
45
Midwest
51.0
34.4%
78%
Oct 07
Oct 30 – Nov 27
46
Northeast
50.8
57.3%
57%
Oct 17
Nov 4 – Dec 2
47
South
50.6
30.6%
68%
Nov 12
Nov 17 – Dec 15
48
Midwest
49.8
40.6%
73%
Oct 29
Nov 10 – Dec 8
49
South
49.4
34.8%
64%
Nov 06
Nov 14 – Dec 12
50
Midwest
49.2
57.5%
57%
Oct 18
Nov 5 – Dec 3
51
South
49.1
26.5%
70%
Nov 02
Nov 12 – Dec 10
52
South
48.5
26.0%
66%
Nov 13
Nov 17 – Dec 15
53
South
48.4
19.4%
79%
Nov 10
Nov 16 – Dec 14
54
Midwest
47.8
28.4%
78%
Oct 11
Nov 1 – Nov 29
55
South
47.5
30.8%
74%
Nov 01
Nov 11 – Dec 9
56
South
46.7
23.5%
72%
Nov 09
Nov 15 – Dec 13
57
South
46.4
28.2%
64%
Nov 03
Nov 12 – Dec 10
58
South
46.2
37.7%
64%
Oct 30
Nov 10 – Dec 8
59
Midwest
46.1
30.8%
70%
Oct 25
Nov 8 – Dec 6
60
Northeast
46.0
35.1%
68%
Oct 19
Nov 5 – Dec 3
61
South
45.8
23.5%
64%
Nov 11
Nov 16 – Dec 14
62
Northeast
45.1
34.3%
53%
Oct 27
Nov 9 – Dec 7
63
Northeast
44.8
37.4%
62%
Oct 11
Nov 1 – Nov 29
64
Midwest
44.7
30.6%
77%
Oct 19
Nov 5 – Dec 3
65
South
44.3
42.5%
61%
Oct 23
Nov 7 – Dec 5
66
Northeast
44.2
32.1%
56%
Oct 14
Nov 3 – Dec 1
67
Midwest
43.8
31.0%
76%
Oct 22
Nov 6 – Dec 4
68
Northeast
43.2
33.9%
65%
Oct 13
Nov 2 – Nov 30
69
South
43.0
34.4%
70%
Oct 27
Nov 9 – Dec 7
70
Northeast
42.6
36.2%
69%
Oct 27
Nov 9 – Dec 7
71
Northeast
42.6
28.8%
59%
Oct 13
Nov 2 – Nov 30
72
Midwest
42.5
36.7%
73%
Oct 29
Nov 10 – Dec 8
73
South
42.3
40.5%
64%
Oct 29
Nov 10 – Dec 8
74
South
42.1
28.3%
66%
Nov 07
Nov 14 – Dec 12
75
Northeast
41.7
43.5%
56%
Oct 29
Nov 10 – Dec 8
76
Northeast
41.6
38.9%
57%
Oct 19
Nov 5 – Dec 3
77
South
41.4
17.1%
67%
Nov 16
Nov 19 – Dec 17
78
South
41.3
26.4%
60%
Nov 07
Nov 14 – Dec 12
79
South
41.2
26.9%
71%
Nov 03
Nov 12 – Dec 10
80
Northeast
41.1
27.8%
57%
Oct 13
Nov 2 – Nov 30
81
Midwest
40.8
33.5%
66%
Oct 29
Nov 10 – Dec 8
82
Midwest
39.6
33.5%
73%
Oct 22
Nov 6 – Dec 4
83
Midwest
39.4
41.1%
66%
Oct 10
Nov 1 – Nov 29
84
Midwest
39.0
28.5%
66%
Oct 29
Nov 10 – Dec 8
85
South
38.9
16.0%
66%
Nov 16
Nov 19 – Dec 17
86
South
38.2
33.3%
68%
Oct 25
Nov 8 – Dec 6
87
South
38.1
25.3%
59%
Nov 14
Nov 18 – Dec 16
88
Northeast
37.9
5.2%
82%
Nov 06
Nov 14 – Dec 12
89
Northeast
37.5
32.1%
56%
Oct 12
Nov 2 – Nov 30
90
South
37.3
21.0%
66%
Nov 06
Nov 14 – Dec 12
91
Northeast
36.7
23.2%
55%
Oct 25
Nov 8 – Dec 6
92
Northeast
36.6
32.5%
58%
Oct 09
Oct 31 – Nov 28
93
Northeast
36.3
25.6%
75%
Oct 26
Nov 8 – Dec 6
94
South
36.1
9.0%
74%
Nov 08
Nov 15 – Dec 13
95
South
35.6
24.1%
69%
Oct 31
Nov 11 – Dec 9
96
Northeast
35.3
12.3%
67%
Oct 11
Nov 1 – Nov 29
97
South
34.8
10.8%
72%
Nov 14
Nov 18 – Dec 16
98
South
34.8
11.7%
70%
Nov 14
Nov 18 – Dec 16
99
South
34.1
30.5%
72%
Nov 02
Nov 12 – Dec 10
100
South
34.1
14.5%
59%
Nov 16
Nov 19 – Dec 17
101
South
34.0
11.8%
61%
Nov 14
Nov 18 – Dec 16
102
Northeast
34.0
27.9%
64%
Oct 31
Nov 11 – Dec 9
103
Midwest
33.7
19.2%
74%
Sep 25
Oct 24 – Nov 21 extrapolated
104
Northeast
33.4
17.6%
57%
Oct 12
Nov 2 – Nov 30
105
Northeast
33.0
34.9%
56%
Oct 26
Nov 8 – Dec 6
106
Midwest
33.0
24.8%
75%
Oct 02
Oct 28 – Nov 25
107
South
32.6
20.7%
73%
Nov 03
Nov 12 – Dec 10
108
South
32.5
10.3%
68%
Nov 04
Nov 13 – Dec 11
109
South
32.2
13.3%
68%
Nov 14
Nov 18 – Dec 16
110
West
32.2
3.3%
71%
Nov 12
Nov 17 – Dec 15
111
South
32.1
0.0%
77%
Nov 25
No fall peak estimated
112
West
32.0
2.5%
69%
Nov 06
Nov 14 – Dec 12
113
Midwest
31.9
26.0%
71%
Oct 29
Nov 10 – Dec 8
114
Northeast
31.6
28.9%
62%
Oct 27
Nov 9 – Dec 7
115
Midwest
31.4
25.2%
72%
Oct 17
Nov 4 – Dec 2
116
Midwest
30.7
15.2%
75%
Oct 13
Nov 2 – Nov 30
117
Northeast
30.5
10.8%
64%
Oct 04
Oct 29 – Nov 26
118
Northeast
29.4
15.2%
58%
Oct 09
Oct 31 – Nov 28
119
Northeast
29.4
34.6%
50%
Oct 12
Nov 2 – Nov 30
120
West
29.3
2.8%
73%
Nov 02
Nov 12 – Dec 10
121
South
29.1
0.0%
73%
Nov 26
No fall peak estimated
122
South
28.8
0.0%
71%
Nov 27
No fall peak estimated
123
Midwest
28.7
17.2%
77%
Oct 19
Nov 5 – Dec 3
124
Midwest
28.4
24.8%
75%
Oct 24
Nov 7 – Dec 5
125
South
28.4
22.6%
70%
Nov 02
Nov 12 – Dec 10
126
Northeast
28.3
27.0%
57%
Oct 07
Oct 30 – Nov 27
127
South
28.2
0.2%
67%
Nov 24
No fall peak estimated
128
South
28.2
6.0%
67%
Nov 10
Nov 16 – Dec 14
129
South
28.1
16.4%
70%
Nov 07
Nov 14 – Dec 12
130
South
28.0
29.1%
44%
Nov 02
Nov 12 – Dec 10
131
Midwest
27.8
25.2%
67%
Oct 03
Oct 28 – Nov 25
132
South
27.2
0.0%
64%
Nov 17
No fall peak estimated
133
Northeast
27.1
21.8%
65%
Oct 18
Nov 5 – Dec 3
134
Midwest
27.1
16.7%
74%
Oct 16
Nov 4 – Dec 2
135
Northeast
27.0
20.3%
60%
Oct 21
Nov 6 – Dec 4
136
Midwest
26.9
28.5%
63%
Oct 27
Nov 9 – Dec 7
137
South
26.3
17.4%
73%
Nov 01
Nov 11 – Dec 9
138
South
26.2
0.0%
72%
Nov 24
No fall peak estimated
139
South
25.9
5.0%
67%
Nov 16
Nov 19 – Dec 17
140
Midwest
25.8
19.2%
65%
Oct 17
Nov 4 – Dec 2
141
West
25.7
3.6%
67%
Nov 04
Nov 13 – Dec 11
142
Midwest
25.7
22.2%
74%
Oct 20
Nov 5 – Dec 3
143
Midwest
25.5
15.0%
76%
Oct 17
Nov 4 – Dec 2
144
South
25.4
0.7%
66%
Nov 17
No fall peak estimated
145
South
25.4
4.9%
73%
Nov 18
Nov 20 – Dec 18 extrapolated
146
Midwest
25.3
14.0%
70%
Oct 18
Nov 5 – Dec 3
147
South
25.2
0.0%
66%
Nov 14
Nov 18 – Dec 16
148
South
25.2
0.0%
65%
Dec 01
No fall peak estimated
149
South
24.8
0.0%
67%
none typical
No fall peak estimated
150
Midwest
24.8
17.5%
69%
Oct 14
Nov 3 – Dec 1
151
Northeast
24.6
11.4%
47%
Oct 18
Nov 5 – Dec 3
152
West
24.1
22.3%
73%
Oct 01
Oct 27 – Nov 24
153
South
24.1
1.6%
65%
Nov 30
Nov 26 – Dec 24 extrapolated
154
Midwest
23.8
17.1%
74%
Nov 01
Nov 11 – Dec 9
155
South
23.8
0.0%
65%
Nov 13
Nov 17 – Dec 15
156
South
23.7
0.0%
62%
Nov 20
No fall peak estimated
157
South
23.6
0.0%
65%
Nov 21
No fall peak estimated
158
South
23.6
5.3%
62%
Nov 07
Nov 14 – Dec 12
159
Northeast
23.5
9.3%
68%
Nov 04
Nov 13 – Dec 11
160
South
23.4
0.9%
69%
Nov 21
Nov 21 – Dec 19 extrapolated
161
West
23.4
0.0%
71%
Oct 30
Nov 10 – Dec 8
162
South
23.2
23.3%
45%
Nov 04
Nov 13 – Dec 11
163
Northeast
23.1
15.0%
48%
Oct 29
Nov 10 – Dec 8
164
Midwest
23.1
19.4%
76%
Oct 29
Nov 10 – Dec 8
165
South
22.8
4.4%
68%
Nov 16
Nov 19 – Dec 17
166
West
22.8
1.8%
56%
Nov 04
Nov 13 – Dec 11
167
Midwest
22.6
23.2%
61%
Oct 21
Nov 6 – Dec 4
168
Northeast
22.5
23.2%
35%
Oct 29
Nov 10 – Dec 8
169
Northeast
22.4
10.8%
55%
Nov 04
Nov 13 – Dec 11
170
Midwest
22.4
14.3%
76%
Oct 17
Nov 4 – Dec 2
171
South
22.4
17.8%
72%
Nov 21
Nov 21 – Dec 19 extrapolated
172
South
22.4
0.0%
64%
Dec 26
No fall peak estimated
173
West
22.2
1.1%
60%
Nov 08
Nov 15 – Dec 13
174
South
22.1
0.0%
62%
Nov 22
No fall peak estimated
175
West
21.9
0.3%
61%
Nov 12
Nov 17 – Dec 15
176
Midwest
21.7
13.5%
74%
Oct 15
Nov 3 – Dec 1
177
South
21.3
0.0%
82%
none typical
No fall peak estimated
178
South
21.1
0.0%
65%
Nov 29
No fall peak estimated
179
South
21.0
0.4%
67%
Nov 14
Nov 18 – Dec 16
180
South
20.9
0.0%
57%
Dec 02
No fall peak estimated
181
South
20.9
17.7%
72%
Nov 06
No fall peak estimated
182
Midwest
20.8
13.5%
68%
Oct 10
Nov 1 – Nov 29
183
South
20.6
0.2%
67%
Nov 16
Nov 19 – Dec 17
184
West
20.1
1.9%
63%
Oct 22
Nov 6 – Dec 4
185
South
20.0
0.0%
70%
Dec 06
No fall peak estimated
186
South
19.9
0.0%
63%
Dec 06
No fall peak estimated
187
West
19.9
0.0%
74%
Oct 10
Nov 1 – Nov 29
188
South
19.8
0.0%
66%
Nov 28
No fall peak estimated
189
South
19.6
0.4%
66%
Nov 08
Nov 15 – Dec 13
190
South
19.6
1.3%
68%
Nov 18
Nov 20 – Dec 18 extrapolated
191
South
19.6
0.0%
60%
Dec 05
No fall peak estimated
192
Northeast
19.3
16.5%
43%
Nov 02
Nov 12 – Dec 10
193
South
19.1
0.1%
52%
Dec 02
No fall peak estimated
194
South
19.0
0.9%
60%
Nov 16
Nov 19 – Dec 17
195
Midwest
19.0
16.2%
57%
Oct 16
Nov 4 – Dec 2
196
South
19.0
15.3%
75%
Oct 31
Nov 11 – Dec 9
197
West
19.0
0.7%
59%
Nov 16
Nov 19 – Dec 17
198
South
18.6
0.4%
70%
Nov 25
No fall peak estimated
199
West
18.5
0.1%
63%
Nov 06
Nov 14 – Dec 12
200
Midwest
18.4
15.9%
69%
Oct 27
Nov 9 – Dec 7
201
Midwest
18.3
15.6%
69%
Oct 19
Nov 5 – Dec 3
202
West
18.0
0.1%
65%
Oct 25
Nov 8 – Dec 6
203
South
17.7
0.0%
68%
none typical
No fall peak estimated
204
South
17.4
0.1%
63%
Nov 09
Nov 15 – Dec 13
205
South
17.2
0.0%
53%
Nov 17
No fall peak estimated
206
West
16.9
0.1%
63%
Dec 18
No fall peak estimated
207
South
16.7
13.5%
64%
Oct 29
Nov 10 – Dec 8
208
South
16.7
0.2%
70%
Nov 08
Nov 15 – Dec 13
209
Midwest
16.5
14.7%
75%
Oct 24
Nov 7 – Dec 5
210
South
16.4
1.2%
66%
Nov 07
Nov 14 – Dec 12
211
Midwest
16.3
10.3%
78%
Oct 17
Nov 4 – Dec 2
212
South
16.1
0.0%
70%
none typical
No fall peak estimated
213
Midwest
16.1
10.7%
76%
Oct 17
Nov 4 – Dec 2
214
South
16.0
0.0%
52%
Dec 01
No fall peak estimated
215
Midwest
15.9
15.2%
71%
Oct 13
Nov 2 – Nov 30
216
Northeast
15.6
15.3%
55%
Nov 02
Nov 12 – Dec 10
217
West
15.4
15.8%
71%
Oct 08
Oct 31 – Nov 28
218
West
15.4
0.9%
71%
Nov 09
Nov 15 – Dec 13
219
Midwest
15.2
14.3%
60%
Oct 08
Oct 31 – Nov 28
220
Midwest
14.6
10.3%
78%
Oct 25
Nov 8 – Dec 6
221
Midwest
14.5
11.3%
70%
Oct 27
Nov 9 – Dec 7
222
South
14.5
0.9%
65%
Nov 24
Nov 23 – Dec 21 extrapolated
223
Midwest
14.4
15.1%
69%
Oct 05
Oct 29 – Nov 26
224
South
14.2
0.0%
66%
none typical
No fall peak estimated
225
South
14.0
0.0%
58%
none typical
No fall peak estimated
226
Midwest
13.7
12.2%
74%
Oct 25
Nov 8 – Dec 6
227
Midwest
13.5
16.9%
55%
Oct 10
Nov 1 – Nov 29
228
Midwest
13.5
11.6%
77%
Oct 17
Nov 4 – Dec 2
229
Midwest
13.4
17.5%
54%
Oct 27
Nov 9 – Dec 7
230
Midwest
13.3
9.6%
73%
Nov 02
Nov 12 – Dec 10
231
West
13.2
0.5%
64%
Nov 10
Nov 16 – Dec 14
232
West
12.5
0.0%
58%
Sep 22
Oct 23 – Nov 20 extrapolated
233
Midwest
12.4
10.1%
75%
Oct 24
Nov 7 – Dec 5
234
West
12.4
0.3%
67%
Dec 18
No fall peak estimated
235
South
12.4
9.2%
63%
Nov 22
Nov 22 – Dec 20 extrapolated
236
South
12.4
0.0%
50%
Dec 13
No fall peak estimated
237
Midwest
12.4
9.4%
67%
Oct 13
Nov 2 – Nov 30
238
South
12.4
0.0%
56%
none typical
No fall peak estimated
239
Midwest
12.4
7.8%
54%
Oct 13
Nov 2 – Nov 30
240
South
12.4
3.5%
66%
Nov 05
Nov 13 – Dec 11
241
South
12.3
0.0%
62%
none typical
No fall peak estimated
242
Midwest
12.0
8.4%
65%
Oct 15
Nov 3 – Dec 1
243
Midwest
11.9
8.4%
65%
Oct 16
Nov 4 – Dec 2
244
West
11.9
10.1%
66%
Sep 29
No fall peak estimated
245
Midwest
11.5
7.4%
70%
Oct 13
Nov 2 – Nov 30
246
South
11.3
0.2%
60%
Nov 09
Nov 15 – Dec 13
247
South
11.1
0.2%
62%
Dec 11
No fall peak estimated
248
South
10.8
0.0%
71%
none typical
No fall peak estimated
249
Midwest
10.5
5.3%
76%
Oct 17
Nov 4 – Dec 2
250
West
10.4
0.1%
66%
Oct 07
Oct 30 – Nov 27
251
South
10.4
0.0%
69%
Dec 10
No fall peak estimated
252
Midwest
10.3
8.1%
74%
Oct 22
Nov 6 – Dec 4
253
South
10.2
0.0%
55%
none typical
No fall peak estimated
254
South
10.1
0.0%
68%
none typical
No fall peak estimated
255
Midwest
10.0
8.0%
74%
Oct 13
Nov 2 – Nov 30
256
South
10.0
0.1%
49%
Nov 10
Nov 16 – Dec 14
257
Midwest
9.8
9.4%
68%
Oct 07
Oct 30 – Nov 27
258
Midwest
9.7
4.4%
70%
Oct 17
Nov 4 – Dec 2
259
Midwest
9.6
8.2%
77%
Oct 25
Nov 8 – Dec 6
260
South
9.5
0.0%
66%
none typical
No fall peak estimated
261
Midwest
9.5
8.5%
72%
Oct 19
Nov 5 – Dec 3
262
South
9.4
0.0%
58%
none typical
No fall peak estimated
263
West
9.4
1.1%
68%
Dec 05
No fall peak estimated
264
Midwest
9.2
7.8%
73%
Oct 19
Nov 5 – Dec 3
265
South
8.8
0.0%
43%
none typical
No fall peak estimated
266
Midwest
8.6
9.3%
65%
Oct 15
Nov 3 – Dec 1
267
Midwest
8.6
6.1%
72%
Oct 14
Nov 3 – Dec 1
268
South
8.4
0.0%
56%
none typical
No fall peak estimated
269
South
8.3
3.6%
59%
Nov 26
Nov 24 – Dec 22 extrapolated
270
South
7.9
0.0%
60%
none typical
No fall peak estimated
271
Midwest
7.7
6.6%
73%
Oct 19
Nov 5 – Dec 3
272
Midwest
7.6
3.5%
72%
Oct 10
Nov 1 – Nov 29
273
South
7.5
0.0%
69%
Dec 15
No fall peak estimated
274
Midwest
7.5
6.3%
52%
Oct 17
Nov 4 – Dec 2
275
West
7.4
0.0%
68%
Oct 17
Nov 4 – Dec 2
276
South
7.4
3.8%
70%
Nov 09
Nov 15 – Dec 13
277
Midwest
7.4
8.6%
63%
Oct 15
Nov 3 – Dec 1
278
West
7.4
0.2%
67%
Dec 08
No fall peak estimated
279
West
7.2
0.0%
66%
Oct 10
Nov 1 – Nov 29
280
West
7.2
1.3%
60%
Dec 12
Dec 2 – Dec 30 extrapolated
281
West
7.1
0.1%
70%
Sep 22
No fall peak estimated
282
Midwest
7.1
9.5%
55%
Oct 24
Nov 7 – Dec 5
283
Midwest
7.1
5.6%
68%
Oct 29
Nov 10 – Dec 8
284
Midwest
7.0
7.0%
70%
Oct 12
No fall peak estimated
285
South
6.9
3.0%
68%
Nov 24
Nov 23 – Dec 21 extrapolated
286
West
6.9
0.3%
57%
Oct 05
Oct 29 – Nov 26
287
West
6.7
0.2%
58%
Sep 13
Oct 18 – Nov 15 extrapolated
288
West
6.6
2.1%
72%
Dec 18
Dec 3 – Dec 31 extrapolated
289
South
6.5
3.2%
53%
Nov 26
Nov 24 – Dec 22 extrapolated
290
West
6.4
7.2%
64%
Oct 07
Oct 30 – Nov 27
291
West
6.3
0.0%
76%
Sep 22
Oct 23 – Nov 20 extrapolated
292
South
6.3
2.1%
66%
Dec 01
Nov 26 – Dec 24 extrapolated
293
South
6.2
0.0%
66%
none typical
No fall peak estimated
294
Midwest
6.1
4.8%
76%
Oct 17
Nov 4 – Dec 2
295
West
6.1
2.7%
67%
Sep 29
No fall peak estimated
296
Midwest
6.0
3.5%
70%
Oct 11
Nov 1 – Nov 29
297
South
5.5
1.1%
66%
Nov 22
No fall peak estimated
298
West
5.5
0.2%
64%
Sep 22
Oct 23 – Nov 20 extrapolated
299
Midwest
5.5
5.2%
70%
Oct 16
Nov 4 – Dec 2
300
Midwest
5.3
8.3%
52%
Oct 17
Nov 4 – Dec 2
301
West
5.2
3.3%
73%
Nov 04
No fall peak estimated
302
West
5.2
0.2%
49%
none typical
No fall peak estimated
303
West
5.2
1.0%
75%
Nov 26
No fall peak estimated
304
Midwest
5.1
2.9%
66%
Oct 12
Nov 2 – Nov 30
305
Midwest
5.1
3.8%
78%
Oct 19
Nov 5 – Dec 3
306
West
4.8
0.0%
63%
Nov 28
No fall peak estimated
307
West
4.5
0.0%
63%
Dec 19
No fall peak estimated
308
Midwest
4.2
3.8%
71%
Oct 17
Nov 4 – Dec 2
309
Midwest
4.1
4.6%
62%
Oct 09
Oct 31 – Nov 28
310
West
4.0
0.0%
56%
Dec 15
No fall peak estimated
311
Midwest
3.9
5.8%
58%
Oct 13
No fall peak estimated
312
South
3.9
0.9%
66%
Dec 12
No fall peak estimated
313
Midwest
3.7
3.6%
72%
Oct 09
No fall peak estimated
314
West
3.6
0.7%
68%
Oct 05
Oct 29 – Nov 26
315
South
3.6
3.1%
73%
Nov 12
No fall peak estimated
316
West
3.5
0.4%
69%
Dec 04
No fall peak estimated
317
West
3.5
0.1%
60%
Oct 15
No fall peak estimated
318
Midwest
3.4
2.9%
71%
Oct 29
No fall peak estimated
319
West
3.4
0.9%
73%
Sep 21
No fall peak estimated
320
West
3.4
0.0%
52%
Dec 04
No fall peak estimated
321
West
3.2
0.0%
70%
Oct 16
Nov 4 – Dec 2
322
West
3.2
0.1%
67%
Sep 29
No fall peak estimated
323
West
3.2
0.7%
57%
Oct 01
Oct 27 – Nov 24
324
Midwest
3.1
3.4%
60%
Oct 15
Nov 3 – Dec 1
325
West
3.0
0.0%
68%
Nov 28
No fall peak estimated
326
West
2.7
0.0%
76%
Dec 16
No fall peak estimated
327
West
2.7
0.1%
50%
none typical
No fall peak estimated
328
South
2.6
2.4%
73%
Nov 15
No fall peak estimated
329
South
2.5
0.0%
41%
none typical
No fall peak estimated
330
West
2.4
0.3%
63%
Oct 13
No fall peak estimated
331
West
2.4
0.0%
48%
none typical
No fall peak estimated
332
West
2.3
0.0%
75%
Dec 18
No fall peak estimated
333
South
2.3
1.7%
80%
Nov 05
No fall peak estimated
334
West
2.2
0.2%
76%
Oct 03
No fall peak estimated
335
Midwest
2.2
1.3%
72%
Oct 10
Nov 1 – Nov 29
336
South
2.1
0.8%
73%
Nov 17
No fall peak estimated
337
Midwest
2.0
0.1%
65%
Oct 04
No fall peak estimated
338
Midwest
1.9
2.4%
60%
Oct 17
Nov 4 – Dec 2
339
West
1.8
0.0%
67%
Nov 06
No fall peak estimated
340
South
1.8
0.0%
68%
Dec 22
No fall peak estimated
341
West
1.7
0.1%
59%
Oct 19
Nov 5 – Dec 3
342
West
1.6
0.3%
72%
Nov 30
No fall peak estimated
343
West
1.5
1.5%
61%
Oct 12
Nov 2 – Nov 30
344
West
1.5
0.3%
67%
Oct 13
No fall peak estimated
345
West
1.5
0.1%
68%
Sep 29
No fall peak estimated
346
Midwest
1.4
2.3%
52%
Oct 02
No fall peak estimated
347
South
1.4
0.2%
66%
none typical
No fall peak estimated
348
South
1.3
0.0%
65%
none typical
No fall peak estimated
349
West
1.3
0.0%
72%
Dec 19
No fall peak estimated
350
South
1.2
0.0%
65%
none typical
No fall peak estimated
351
Midwest
1.1
0.4%
71%
Oct 13
No fall peak estimated
352
West
1.0
0.1%
76%
Oct 10
No fall peak estimated
353
West
1.0
0.0%
66%
Oct 26
No fall peak estimated
354
West
1.0
0.0%
74%
Dec 16
No fall peak estimated
355
Midwest
0.9
1.0%
56%
Oct 17
No fall peak estimated
356
West
0.8
0.0%
65%
Nov 09
No fall peak estimated
357
Midwest
0.7
0.9%
61%
Oct 05
No fall peak estimated
358
Midwest
0.7
0.8%
58%
Sep 29
No fall peak estimated
359
Midwest
0.6
0.9%
56%
Sep 28
No fall peak estimated
360
West
0.6
0.2%
77%
Oct 07
No fall peak estimated
361
West
0.6
0.0%
62%
Nov 22
No fall peak estimated
362
West
0.5
0.1%
60%
Oct 12
No fall peak estimated
363
Midwest
0.5
0.9%
47%
Oct 03
No fall peak estimated
364
West
0.5
0.0%
69%
Dec 14
No fall peak estimated
365
South
0.5
0.1%
71%
Nov 13
No fall peak estimated
366
West
0.4
0.0%
66%
Oct 25
No fall peak estimated
367
West
0.4
0.1%
57%
Oct 15
No fall peak estimated
368
West
0.4
0.0%
71%
Dec 06
No fall peak estimated
369
West
0.3
0.0%
71%
Sep 27
No fall peak estimated
370
South
0.3
0.0%
70%
Dec 10
No fall peak estimated
371
West
0.3
0.0%
60%
Dec 02
No fall peak estimated
372
West
0.2
0.0%
60%
Dec 02
No fall peak estimated
373
West
0.2
0.0%
60%
Nov 09
No fall peak estimated
374
South
0.2
0.1%
70%
Oct 28
No fall peak estimated
375
West
0.2
0.0%
65%
Dec 14
No fall peak estimated
376
West
0.1
0.0%
66%
Sep 26
No fall peak estimated
377
South
0.1
0.1%
67%
Nov 07
No fall peak estimated
378
West
0.1
0.0%
73%
Oct 05
No fall peak estimated
379
South
0.1
0.0%
68%
Nov 08
No fall peak estimated
380
South
0.1
0.0%
58%
Nov 13
No fall peak estimated
381
South
0.0
0.0%
62%
Nov 14
No fall peak estimated
382
West
0.0
0.0%
62%
none typical
No fall peak estimated
383
West
0.0
0.0%
55%
Dec 24
No fall peak estimated
Interactive map
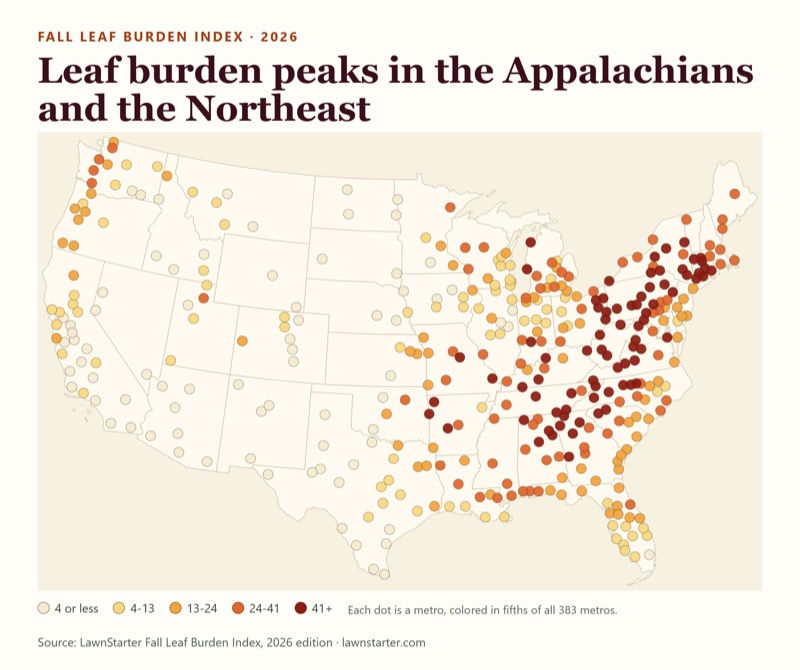
Where leaf burden is heaviest
Each dot is a metro. Darker means a heavier fall leaf burden. Switch the layer to see what drives the pattern, or zoom to a region.
Dots are placed at each metro's Census internal point. Metros are metropolitan statistical areas, which can include a lot of rural land; the map shows the metro, not its built-up core. A text version of every number is in the ranking table above.
Leaf cleanup calendar
When does leaf cleanup peak in your city?
Drag the date and watch the season move across the country. Orange dots are metros in their estimated peak cleanup window; green dots have not reached it yet; gray dots are past it. White dots have no fall peak estimate.
How many metros are in peak, day by day
259 metros have a peak estimate. 124 do not (see methodology).
Metros peaking on this date
Your metro
Pick a metro in the finder at the top of the page to see its peak window and first frost on one timeline.
How to read the calendar
Peak windows are modeled, not measured. The estimated end of the cleanup season is 191.5 + 0.498 × the day of the year of the typical first autumn frost (1991–2020), and the peak window is the 28 days ending there. Calibration on 46 fall-peaking metros gave an average error of about 6 days for the season end, and the right peak month 89% of the time versus 83% for guessing November everywhere. These windows estimate cleanup timing; they do not measure when leaves actually fall.
Median index 41.6 · 9 in the top 25 · 16 in the top 50 · 0 in the bottom 50. Highest-ranked: Altoona, PA (#8).
South (157 metros)
Median index 23.8 · 16 in the top 25 · 31 in the top 50 · 12 in the bottom 50. Highest-ranked: Charleston, WV (#1).
Midwest (94 metros)
Median index 13.4 · 0 in the top 25 · 3 in the top 50 · 10 in the bottom 50. Highest-ranked: Traverse City, MI (#45).
West (83 metros)
Median index 3.6 · 0 in the top 25 · 0 in the top 50 · 28 in the bottom 50. Highest-ranked: Bremerton, WA (#110).
Why You Shouldn’t Let Leaves Pile Up on Your Lawn
A thick, matted layer of whole leaves can smother grass, hold moisture, and create problems for a lawn.
“The biggest mistake people make is that they just leave the thick layer or piles of leaves right on the lawns where they smother grass, get covered with the snow and create an environment for grass fungal diseases, attract pests, and impact soil health as well.”
“My recommendation would be to rake leaves and either mulch them or dispose of them, then set the mower at low for the last mowing of the season.”
“Leaves can also become slippery on sidewalks, driveways, and other high-traffic areas, so those areas should be kept clear.”
“So rather than thinking of fallen leaves as waste that needs to be bagged and hauled away, I encourage homeowners to think of them as a resource that can be recycled back into their landscape.”
When should you rake instead of mulch?
“If you're trying to mow with the mower and you're seeing leaves pile up in front of the mower, almost like you’re pushing leaves, then you have too many. Or if you can't see the grass for the leaves, you have too many.”
Where to See Great Fall Colors in West Virginia and Ohio
Seven of the 10 highest-burden metros include West Virginia. For a fall-color visit, extension educators point to state parks and scenic drives in West Virginia and Ohio.
“I would say any of the state parks would be a great spot for color watching. I have the most experience with the newest State Park, the New River Gorge. Dolly Sods, Canaan Valley, and Blackwater Falls come to mind as well.”
“My wife and I, the conference we were just at, was in the Canaan Valley/Dolly Sods area, and it was beautiful.”
The mountainous eastern part of West Virginia is another favorite area for leaf peeping.
“The leaf change depends on what kind of season we had. When we have a dry year, then a lot of times the foliage isn’t as pretty. It seems like the lower elevations, they change a lot quicker. It seems like when you have more moisture, the leaves are more vibrant and, you know, they'll hang on a little bit longer. And then it's a slow change process.”
Ohio has 12 metros in the Leaf Burden Index. Erika Lyon of Ohio State University Extension recommends eastern Ohio for fall color.
“That’s a tough one because there are so many great places to see fall color in Ohio, especially here in the eastern part of the state where we have so much forested land.”
“One of my favorite drives is along State Route 22 between Steubenville and the Piedmont Lake area. You can see some really vibrant reds, oranges, and yellows through that stretch. I also enjoy Harrison State Forest. Cuyahoga Valley and Hocking Hills are also beautiful places to experience Ohio’s fall color.”
By state
Median index of the metros whose first-listed state is the state, for states with at least 3 metros. States are ordered by that median; this is a summary of metros, not a statewide ranking or measurement.
Median Leaf Burden Index by state
Order
State
Metros
Median index
Highest-ranked metro
1
West Virginia
7
92.3
Charleston, WV (#1)
2
Virginia
9
55.8
Winchester, VA-WV (#6)
3
Connecticut
5
54.9
Norwich-New London-Willimantic, CT (#21)
4
Tennessee
10
51.3
Chattanooga, TN-GA (#9)
5
Arkansas
5
45.8
Fayetteville-Springdale-Rogers, AR (#23)
6
New York
13
43.2
Kingston, NY (#15)
7
Pennsylvania
16
42.2
Altoona, PA (#8)
8
Massachusetts
6
41.9
Pittsfield, MA (#25)
9
North Carolina
15
36.1
Asheville, NC (#13)
10
Maryland
4
35.8
Hagerstown-Martinsburg, MD-WV (#37)
11
Alabama
12
34.4
Gadsden, AL (#27)
12
Kentucky
6
33.3
Louisville/Jefferson County, KY-IN (#69)
13
Georgia
14
32.0
Gainesville, GA (#16)
14
Maine
3
30.5
Portland-South Portland, ME (#96)
15
Missouri
8
29.4
Cape Girardeau, MO-IL (#48)
16
Mississippi
3
28.8
Jackson, MS (#98)
17
Ohio
12
27.0
Akron, OH (#59)
18
Michigan
15
25.3
Traverse City, MI (#45)
19
New Jersey
3
23.1
Vineland, NJ (#159)
20
South Carolina
8
22.4
Greenville-Anderson-Greer, SC (#47)
21
Louisiana
10
22.1
Slidell-Mandeville-Covington, LA (#111)
22
Washington
11
20.1
Bremerton-Silverdale-Port Orchard, WA (#110)
23
Oregon
8
18.7
Grants Pass, OR (#161)
24
Indiana
12
17.3
Bloomington, IN (#50)
25
Minnesota
5
14.4
Duluth, MN-WI (#103)
26
Florida
22
13.2
Pensacola-Ferry Pass-Brent, FL (#138)
27
Wisconsin
13
12.4
La Crosse-Onalaska, WI-MN (#83)
28
Oklahoma
4
12.2
Tulsa, OK (#99)
29
Kansas
4
10.2
Topeka, KS (#226)
30
Montana
5
6.7
Missoula, MT (#232)
31
Utah
5
6.4
Ogden, UT (#152)
32
Illinois
8
6.3
Peoria, IL (#228)
33
Iowa
8
6.2
Dubuque, IA (#215)
34
Colorado
7
3.6
Grand Junction, CO (#217)
35
California
25
3.5
Santa Cruz-Watsonville, CA (#206)
36
Idaho
6
3.3
Coeur d'Alene, ID (#187)
37
Texas
26
3.2
Longview, TX (#160)
38
Nebraska
3
3.1
Omaha, NE-IA (#299)
39
New Mexico
4
0.9
Santa Fe, NM (#330)
40
North Dakota
4
0.7
Grand Forks, ND-MN (#346)
41
Arizona
7
0.6
Prescott Valley-Prescott, AZ (#339)
42
Nevada
3
0.5
Carson City, NV (#317)
Fall is changing
The climate backdrop: a warmer, later fall
A separate LawnStarter analysis of fall climate across the same 383 metros finds a consistent shift between the 1991–2020 baseline and 2016–2025.
+1.35°F
warmer falls in every metro
All 383 metros had a warmer fall (September to November) in 2016–2025 than in 1991–2020. The typical metro ran 1.35°F warmer.
12 vs 9
unusually hot fall days a year
The typical metro now averages about 12 unusually hot fall days per year, compared with about 9 in 1991–2020. The number increased in 382 of 383 metros.
282 of 324
metros saw a later first freeze
Among metros with enough station data, the median first freeze moved later in 282, by a median of 5 days. If the same relationship held, the estimated end of the cleanup season would move roughly 2 to 3 days later in the typical metro (a rough implication, not a measured result).
Sources: NOAA NCEI nClimGrid-Daily and GHCN-Daily (see the source list). Fall is September 1 to November 30. “Recent” is 2016–2025; the baseline is 1991–2020.
Methodology
How we calculated the Fall Leaf Burden Index
The index compares 383 metropolitan statistical areas in the contiguous United States (OMB July 2023 delineation, Census TIGER/Line 2024 boundaries). It covers fall leaf drop from deciduous trees only.
Leaf Supplydeciduous forest cover (2) + total tree canopy (1)
×
Cleanup Intensitydetached homes (3) + developed land (1) + leaf-drop window (1) + autumn rain (1)
→
Leaf Burden Indexrescaled so the top metro = 100
Each input is converted to a 0-100 score across the 383 metros: score = (value − minimum) ÷ (maximum − minimum) × 100. Within each half, the score is the weighted average of its inputs (weights in parentheses above). The two halves are multiplied and divided by 100, then divided by the highest result so that the top metro scores 100. Ties share a rank.
Why multiply instead of add? An additive (weighted-average) version of the same inputs ranks Houston #187 of 383 even though only 0.2% of its land is deciduous forest, because homes, developed land and rain alone earn it points; in the index it ranks #247. Multiplying means a metro needs both leaves and exposure to rank high.
The six inputs
Input
Weight
What it captures
Source
Deciduous forest cover
2 of 3 in Leaf Supply
Share of the metro's land classed as deciduous forest: areas dominated by trees generally taller than 5 m with more than 20% of vegetation cover, where more than 75% of the tree species shed leaves seasonally (NLCD class 41). Whole 30 m pixels are counted, so this share can exceed average canopy cover.
Annual NLCD
Total tree canopy cover
1 of 3 in Leaf Supply
Average tree canopy cover as a percent of land area (USFS Tree Canopy Cover), a check on overall tree density that includes planted and mixed trees.
USFS Tree Canopy Cover
Detached single-family homes
3 of 6 in Cleanup Intensity
Share of housing units that are 1-unit detached homes, the homes with yards and trees to clear.
ACS 2020-2024 5-year, DP04
Developed land
1 of 6 in Cleanup Intensity
Share of land classed as developed (open space through high intensity), where people live and leaves become a cleanup problem.
Annual NLCD classes 21-24
Leaf-drop window length
1 of 6 in Cleanup Intensity
Days between the start of autumn greenness decline (satellite “senescence”, when greenness last crosses 90% of its seasonal range) and dormancy (15%), for 2024. A longer season means a longer cleanup. Weakest input.
MODIS MCD12Q2
Autumn precipitation
1 of 6 in Cleanup Intensity
September to November precipitation, 1991–2020 normal, averaged across the metro. Wet leaves are heavier and mat down.
NOAA daily gridded climate normals
Estimated peak window (separate from the ranking)
Estimated cleanup-season end = 191.5 + 0.498 × first autumn frost (day of year, 1991–2020 median). The peak window is the 28 days ending at the season end and the peak month is the month of its midpoint. It was calibrated against observed cleanup timing (dates only, no volumes) from LawnStarter service records in 46 fall-peaking metros; the average leave-one-out error is about 6 days for the season end. Confidence tiers: Calibrated (241 metros whose first frost falls inside the range of the 46 metros used to fit the model), Extrapolated (18 metros whose first frost is outside that range) and Not estimated (124 metros: 64 with very little tree canopy over developed land, 35 with mostly evergreen or mixed canopy and late frost, 25 with no typical autumn frost). The peak window does not affect the ranking.
Limitations you should know about
Leaf supply is measured at the regional forest level. It cannot see the trees over yards and streets where leaves become cleanup work. About 87% of Seattle's street trees are deciduous by count (79% by trunk area; genus-based classification of the city's SDOT street tree inventory, trees in service), yet the Seattle metro ranks #166. Treat Western and Pacific Northwest ranks as directional.
Metro boundaries include rural land. Farmland-heavy Midwest metros are diluted on forest share (Chicago ranks #274).
The leaf-drop window is the weakest input: one year (2024) of satellite data, all land pixels, and 38 metros with under 50% valid pixels. It carries weight 1.
Precipitation and frost are metro-wide gridded values. Precipitation comes from NOAA’s daily gridded climate normals and frost from NOAA’s nClimGrid-Daily; both are area-weighted across the whole metro, hills and mountains included, so they can differ from the airport weather station for the same city (the Seattle metro averages 22.6 inches of September-November precipitation, while the Sea-Tac airport station normal is about 12 inches, largely because the metro reaches into the wetter Cascade foothills and mountains). Frost is the first day from August to December with a daily minimum below freezing (32 °F), taken as the median of 1991–2020 and then across the metro’s grid cells; metro-wide medians can sit earlier than the airport station for the same city (cooler rural and upland land) or later (the strict below 32 °F threshold is colder than the 32 °F-or-below convention of NOAA’s freeze normals).
Precipitation is a seasonal total from 1991–2020 normals, not a count of rainy days. We tested a fall 2025 rainy-day count; it covers one year and changed the ranking almost not at all, so it was not used.
Evergreen leaf drop is out of scope. Evergreens such as live oak, which keeps most of its leaves through winter and sheds them as new growth emerges in spring, are outside the index. Texas and Florida metros score low mainly because little of their land is deciduous forest.
We tested a satellite measure of deciduous canopy over developed land and removed it after checks against street trees of known species in Seattle and New York City showed it did not separate deciduous from evergreen trees.
The index is comparative. It is not a count of leaves, bags or dollars.
Ranking stability. Across six weighting variants (equal weights, and dropping autumn precipitation, the leaf-drop window, developed land, total tree canopy, or both timing-and-conditions inputs), 22 to 23 of the top 25 metros and 7 to 10 of the top 10 stay the same. Dropping total tree canopy changes mid-table ranks most (rank correlation 0.79).
Land area shown in our data tables is the Census 2024 Gazetteer figure and feeds no score. Percent inputs were computed against land area derived from the same satellite grids and differ from the Census figure by a median of 0.15%.
FAQ
Frequently asked questions about the Fall Leaf Burden Index
Which U.S. city has the most fall leaves to clean up?
Charleston, WV ranks first on the 2026 Fall Leaf Burden Index, with Beckley, WV second and Huntington-Ashland, WV-KY-OH third. The top five metros all include West Virginia. The index is a relative burden score, not a count of leaves. It scores 383 metropolitan areas on how much deciduous forest surrounds them, how much yard-and-housing exposure they have and how hard the cleanup is.
How is the Fall Leaf Burden Index calculated?
Each metro gets a Leaf Supply score (deciduous forest cover and total tree canopy) and a Cleanup Intensity score (detached single-family homes, developed land, the length of the leaf-drop season and autumn rainfall). The two are multiplied, so a metro needs both leaves and homes to rank high, and the top metro is set to 100. Each input is scaled from 0 to 100 across the 383 metros.
When does leaf cleanup peak?
In 221 of the 241 metros where we could calibrate timing (92%), the estimated peak falls in November, and in 20 warm metros it falls in December (the 124 metros with no fall peak estimate are not counted). The model is only modestly better than assuming November everywhere: it gets the peak month right 89% of the time versus 83%. The estimated season end is about 191.5 plus half a day (0.498) for each day the typical first frost arrives later, and the peak window is the 28 days ending there. Look up any metro in the calendar above.
Why do Texas and Florida rank so low?
The index measures fall leaf drop from deciduous trees. Texas and Florida metros tend to rank lower because little of their land is deciduous forest: the median Texas metro is 0.5% and the median Florida metro is 0.0%, compared with 6.0% across all metros. Evergreens such as live oak—which keeps most of its leaves through winter and sheds them as new growth emerges in spring—are outside the index. Among 26 Texas metros, the median rank is 320; among 22 Florida metros, it is 230. None ranks in the top 100. Spring leaf drop would require a separate index.
Is the ranking reliable for the West and the Pacific Northwest?
Treat Western ranks as directional. Leaf supply is measured from regional forest cover and total tree canopy, which cannot see the planted deciduous trees along streets and in yards. In Seattle, for example, our check of the city's street tree inventory found about 87% of street trees were deciduous by count, yet the Seattle metro ranks #166.
Does the index measure how much leaf cleanup costs or how many leaves fall?
No. It is a comparative index of burden, not a count of leaves, bags or dollars, and it contains no pricing. It compares metros with each other on land cover, housing, climate and timing inputs from public sources.
Why is the leaf-drop window only a small part of the score?
The satellite-measured leaf-drop window is the least reliable input. It uses one year of satellite data (2024), covers all land rather than tree cover alone, and had fewer than 50% valid pixels in 38 metros. It carries a weight of 1, the same as developed land and autumn precipitation, and dropping it changes only 2 of the top 25 metros.
Can I use these statistics?
Yes. Please credit LawnStarter, name the LawnStarter Fall Leaf Burden Index, 2026 edition, and link to this page. All 383 rows are available as a CSV download below, and every statistic on the page has a copy button with the attribution included.
Data and sources
Download the data, cite the study, and check our sources
Graphics for press and social
Free to use with credit to LawnStarter and a link to this page.
Infographic: the 10 most leaf-burdened U.S. metros, led by Charleston, WV at 100, Beckley, WV at 98.0 and Huntington-Ashland, WV-KY-OH at 92.8. Download imageMap of 383 U.S. metros colored by Fall Leaf Burden Index, darkest across Appalachia and the Northeast and lightest in the West. Download imageChart of how many metros are in their estimated leaf cleanup peak by day, busiest on Nov 24, with 92% of calibrated metros peaking in November. Download imageNine statistics from the Fall Leaf Burden Index, including 84% deciduous forest in Charleston, WV and 7 of 7 West Virginia metros in the top 50. Download image
Suggested citation LawnStarter. (2026). Fall Leaf Burden Index, 2026 edition: 383 U.S. metropolitan areas compared for fall leaf cleanup burden. October 28, 2026.
Sources
Annual NLCD 2025 land cover (deciduous forest, class 41; developed classes 21-24). U.S. Geological Survey. Annual NLCD land cover, 2025 (30 m). Class definitions: Multi-Resolution Land Characteristics (MRLC) Consortium, Annual NLCD Land Cover Legend. https://www.mrlc.gov/data/legends/annual-nlcd-land-cover-legend
Sources were reviewed in October 2026. We checked the published data for completeness and plausible ranges. Data collection took place from September through October 2026.
About the author
Alice Onofrei
Senior Research Manager at LawnStarter
Alice Onofrei is Senior Research Manager at LawnStarter. She leads data collection and analysis for a wide range of statistical studies. She is passionate about making research accessible and relevant, and she prioritizes accuracy and clarity as she turns complex data into meaningful insights.
Editor’s Note:LawnStarter writer Danielle Gorski contributed to this report by interviewing OSU Extension’s Erika Lyon and WVU Extension’s Mirjana Bulatovic-Danilovich and David Richmond.