When you have a question about landscaping in your geographical area, you might consult the Farmer’s Almanac for planting charts or frost dates, or look at the USDA’s Plant Hardiness Zone Map for plant hardiness.

But there is another chart that could help you with your landscape decisions — the Köppen climate classification system.
“The Köppen climate classification system divides the planet up into 5 different (A,B,C,D,E) zones based on differences in average temperature and moisture (snow/rain),” says Tony Pann, a meteorologist at WBAL-TV in Baltimore. “You can use this classification system to decide what kinds of plants and vegetables would do well in your area.”
Its categories are based on the annual and monthly averages of temperature and precipitation. The original Köppen system recognizes the five major climatic types; each type is designated by a capital letter.
History of Köppen Climate Classification System
This system was first published by German climatologist Wladimir Köppen in 1900. He based his system on the empirical relationship between climate systems and vegetation. Köppen studied vegetation types and took many factors into consideration, including rainfall, soil type, humidity, and other variables that would affect plants and their growth.
He modified the system several times, most notably in 1918 and 1931, and in 1961 climatologist Rudolf Geiger made changes, causing some to label it the Köppen-Geiger climate classification system. “The boundaries are reevaluated every few years based on how the global and local climate types have been changing (rainfall, temps, etc.),” says Pann.
Köppen System’s Main Climate Types
The five major climatic types on the Köppen system are designated by a capital letter:
A – Tropical Climates: high temperatures year-round, with a large amount of year-round rain.
B – Dry Climates: areas that have little rain and a huge daily temperature range. Two subgroups are used within this designation — semiarid or steppe (S), arid or desert (W). For instance, BW would indicate an arid climate.
C – Temperate Climates: warm, dry summers and cool, wet winters.
D – Continental Climates: Precipitation is not very high and seasonal temperatures have wide variance.
E – Polar Climates: This type of climate has permanent ice and tundra and has two subgroups – tundra (T) and ice cap (F). ET indicates a tundra climate, with an average temperature of below 50 degrees Fahrenheit. EF is an ice cap climate, with all 12 months of the year having temperatures of less than 32 degrees Fahrenheit.
A sixth classification, Highland areas, was added after Köppen created the system, as part of the later modification called the Köppen-Geiger-Pohl system. Designated by the Letter H, Highlands areas can include mountainous areas that are not easily classified by the other 5 categories.
Köppen Subsections Indicate Temperature, Rainfall
The Köppen climate classification system breaks down the five groups into smaller sections designated by using a second letter. The subgroups show seasonal characteristics that include monthly temperature and rainfall. According to the Sustainability Council, the subgroups are:
f: accompanies groups A, C, and D. No dry season, with mist conditions and adequate annual precipitation the entire year. Only used in A group climates, this letter denotes a rainforest climate, with a short dry season and a tropical monsoon cycle.
s: A dry season is found during high-sun, or summer.
w: These areas have a dry winter season, or during a low-sun period of the year.
To further categorize the groups, a third letter completes the code:
a: In C and D groups, this letter designates a hot summer of over 72 degrees Fahrenheit in the warmest month. For example, a place designated Dfa — such as Chicago — would mean a hot summer humid continental climate.
b: In C and D groups, the letter b indicates a warm summer where the warmest summer month is below 72 degrees Fahrenheit. Cwb is a subtropical highland climate.
c: In C and D climate groups, this subgroup has a cool summer with less than four months over 50 degrees Fahrenheit. A Cfc designation would indicate a subpolar oceanic climate.
d: This letter is used only in the D group. It denotes very cold winters with temperatures below – 36 degrees Fahrenheit in the coldest month. Dfd is an extremely cold subarctic climate.
h: In B climates, the letter h indicates a dry-hot mean annual temperature of over 64 degrees Fahrenheit. Bsh would indicate a hot semi-arid climate.
k: The letter k marks B climates only that are dry-cold with a mean temperature of under 64 degrees Fahrenheit annually. A classification of BWk would mean the area is a cold desert climate.
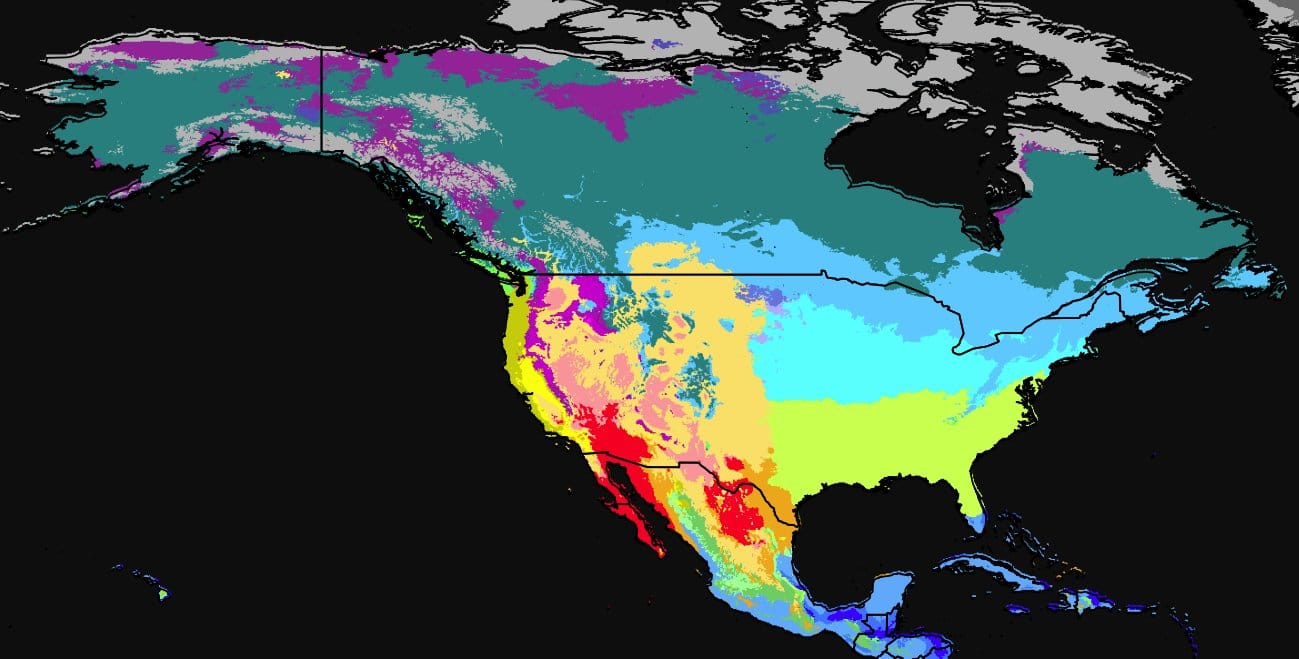
Use these Köppen letter codes to understand the climate in your location on this United States map:

Using With USDA Zone Map
The USDA Zone divides North America into 13 zones, with some zones subdivided into smaller subzones. Zones are primarily based on the average annual minimum winter temperature. Boundary lines divide zones so that they differ by 5 to 10 degrees Fahrenheit. Most gardeners use the USDA map to determine which plants or varieties of plants would do well in their regions.
The USDA Zone map does not consider things like snow cover in polar climates and how it affects perennials; freezing and thawing; terrain; marine conditions in coastal areas; and more. Zones are based on average yearly minimum temperatures during the past 30 years. (The Köppen classification uses vegetation and vegetation distribution to help determine climate zones). In certain locales, gardeners might experience microclimates that, in effect, bump them up or down a zone. Sacramento and Phoenix are in the same zone on the USDA Zone map, but the cities have distinctly different growing conditions.
The USDA updated its plant hardiness map in 2012, based on 1976–2005 weather data. In the process, it added two zones to better reflect tropical and semitropical plants, mainly in Hawaii and Puerto Rico.
| Major U.S. Cities' Köppen Climate Classification, USDA Hardiness Zones | ||
|---|---|---|
| City | Köppen Climate Classification | USDA Hardiness Zone |
| Charlotte | Cfa: Humid subtropical | 7b |
| Chicago | Dfa: Humid continental | 6a |
| Dallas | Cfa: Humid subtropical | 8a |
| Denver | Bsk: Cold, semi-arid | 5b |
| Houston | Cfa: Humid subtropical | 9a |
| Jacksonville | Cfa: Humid subtropical | 9a |
| Kansas City | Dfa: Hot-summer humid continental | 6a |
| Los Angeles | Csa: Hot-summer Mediterranean | 10b |
| Miami | Am: Tropical monsoon | 11a |
| Milwaukee | Dfa: Hot-summer humid continental | 5b |
| Minneapolis | Dfb: Warm-summer humid continental | 4b |
| Nashville | Cfa: Humid subtropical | 7a |
| Phoenix | Bwh: Tropical and subtropical desert | 9b |
| Portland, Ore. | Csb: Warm-summer Mediterranean | 9a |
| Richmond, Va. | Cfa: Humid subtropical | 7a |
| Sacramento | Csa: Hot-summer Mediterranean | 9b |
| St. Louis | Cfa: Humid subtropical | 6b |
| Salt Lake City | Dfb: Warm summer continental | 7a |
| San Diego | Bsk: Cold, semi-arid | 10b |
| San Francisco | Csc: Cold-summer Mediterranean | 10b |
| Seattle | Csb: Warm-summer Mediterranean | 8b |
| Washington, D.C. | Cfa: Humid subtropical | 7b |
Adjusting for Climate Change
The world is constantly changing, and so is the climate. A world map for the period 2003-2100, presented by Climate Change and Infectious Diseases, is based on global climate models provided by the Tyndall Centre for Climate Change Research.
These updated maps show a shift of climate within the five zones, as temperate zones got larger and polar regions shrunk. “Compared with a single variable approach, the Köppen climate classification can add a new dimension to the description of climate variation,” state Deliang Chen and Hans Weiteng Chen in their 2013 article published by Environmental Development. “Over the recent years, there has also been an increasing interest in using the classification to identify changes in climate and potential changes in vegetation over time.”
No single map can offer a complete picture for a homeowner. The Köppen climate classification map can add to your knowledge gleaned from the USDA zone map and Farmer’s Almanac. Pann suggests homeowners also consult an expert in this field and research online when making major landscaping decisions.
But no Köppen out — your landscape will benefit from your climate know-how!