Aside from being in the same county in the Charlotte, NC, metro area, the South Carolina towns of York and Clover have something else in common. Among South Carolina towns with at least 5,000 residents, York and Clover have the least amount of disaster protection in the form of flood insurance.
A LawnStarter analysis of data from the National Flood Insurance Program (NFIP) shows that as of July 31, 2015, only one policy each is in effect in York and Clover. On a per-household basis, York has the lowest rate of coverage through the federal program, with Clover sits in second place on this dubious list. The lion’s share of flood insurance policies in the U.S. are purchased through the NFIP.
On the other end of the flood-insurance spectrum, our data review shows two coastal communities — North Myrtle Beach and Hilton Head Island — are the most protected among South Carolina cities with at least 5,000 residents. In all, 60 cities are on our list. (Data for each city appears in a table at the end of this blog post.)

LawnStarter calculated the flood insurance rates in South Carolina by taking the number of flood insurance policies in effect in a city and dividing it by the number of households. Figures are for each city only, not an entire metropolitan area.
Suffering in South Carolina
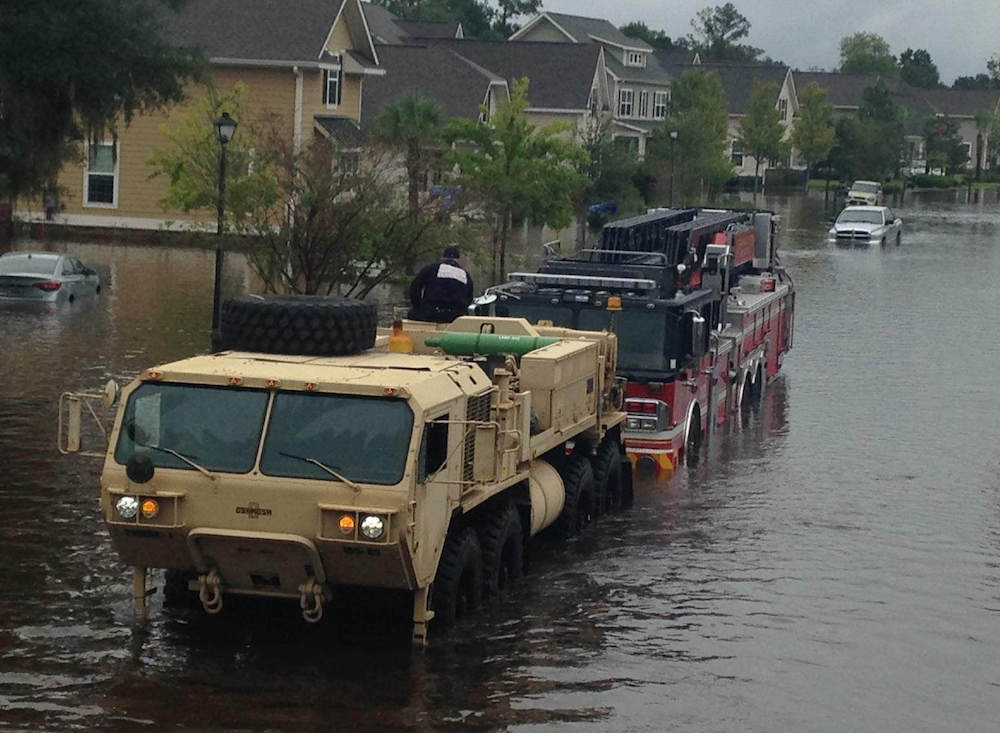
The subject of flood insurance has taken center stage in South Carolina as the Palmetto State copes with historic flooding. Final numbers haven’t been calculated, but early estimates peg the damage at more than $1 billion. Over a dozen deaths have been blamed on the flooding.
“One of the biggest issues why people don’t carry flood insurance is apathy.”
— Loretta Worters, Insurance Information Institute
The inland towns of York and Clover have been spared the deluge of floodwater witnessed in other parts of South Carolina, including Columbia and Charleston. Still, York and Clover — along with all other communities in South Carolina — aren’t immune from flooding.
Russ Dubisky, executive director of the South Carolina Insurance News Service, says a majority of the NFIP policies in South Carolina cover properties in coastal areas. Most of those policyholders are in special flood hazard zones and may be required by their mortgage lenders to buy coverage, he says. For people outside those zones, flood risk is rated as low to moderate and coverage is optional.
As of July 31, South Carolina had 199,540 NFIP policies in force, while the state has close to 1.8 million households. According to the South Carolina Insurance News Service, about 10 percent of homeowners in South Carolina are covered by flood insurance. A 2015 survey by the industry-supported Insurance Information Institute found that just 14 percent of U.S. homeowners carry flood insurance.
Apathy and Frugality
“One of the biggest issues why people don’t carry flood insurance is apathy. I think many people think it won’t happen to them and are willing to take the risk,” says Loretta Worters, a spokeswoman for the Insurance Information Institute.

Aside from apathy, some property owners and renters lack flood insurance because they think it’s too expensive, Worters says. The average cost of a flood insurance policy is $700 a year, she says, while the average flood insurance claim is about $42,000.
“I don’t think it’s worth the risk,” Worters says.
Flood Insurance 101
Flood damage isn’t covered by standard homeowner’s, renter’s and business insurance policies. However, flood coverage is available separately from the NFIP and a few private insurers.
The NFIP provides coverage for up to $250,000 for the structure of a home and $100,000 for personal belongings. For businesses, the coverage is $500,000 for a commercial structure and $500,000 for its contents.
Check out the table below for a complete list of data for South Carolina communities with at least 5,000 residents. (Flood insurance data was not available for James Island and Union.)
| City | Population (2014) | # of households | # of NFIP policies | Policies per household |
|---|---|---|---|---|
| York | 8,038 | 2,697 | 1 | 0.0003707823508 |
| Clover | 5,579 | 1,871 | 1 | 0.0005344735436 |
| Central | 5,149 | 2,042 | 2 | 0.0009794319295 |
| Laurens | 9,182 | 3,849 | 5 | 0.001299038711 |
| Greer | 27,676 | 10,128 | 19 | 0.001875987362 |
| Batesburg-Leesville | 5,423 | 2,041 | 4 | 0.001959823616 |
| Fountain Inn | 8,134 | 2,848 | 6 | 0.002106741573 |
| Seneca | 8,246 | 3,738 | 8 | 0.002140181915 |
| Clinton | 8,619 | 2,508 | 6 | 0.002392344498 |
| Abbeville | 5,191 | 2,081 | 5 | 0.002402691014 |
| Gaffney | 12,597 | 4,845 | 13 | 0.002683178535 |
| Fort Mill | 13,087 | 4,547 | 13 | 0.002859027931 |
| Lake City | 6,732 | 2,448 | 7 | 0.002859477124 |
| Chester | 5,494 | 2,098 | 6 | 0.00285986654 |
| Greenwood | 23,236 | 8,716 | 27 | 0.003097751262 |
| Anderson | 27,181 | 10,814 | 38 | 0.003513963381 |
| Tega Cay | 9,120 | 2,699 | 10 | 0.003705075954 |
| Cheraw | 5,793 | 2,685 | 10 | 0.003724394786 |
| Spartanburg | 37,525 | 15,488 | 59 | 0.003809400826 |
| Easley | 20,549 | 8,155 | 35 | 0.004291845494 |
| Dillon | 6,658 | 2,604 | 12 | 0.004608294931 |
| Rock Hill | 69,967 | 26,307 | 123 | 0.004675561638 |
| Lexington | 19,893 | 7,245 | 35 | 0.004830917874 |
| Darlington | 6,206 | 2,658 | 13 | 0.00489089541 |
| Simpsonville | 20,125 | 7,417 | 37 | 0.004988539841 |
| Aiken | 30,258 | 12,304 | 64 | 0.005201560468 |
| Newberry | 10,268 | 3,878 | 22 | 0.005673027334 |
| Marion | 6,751 | 2,527 | 15 | 0.005935892362 |
| West Columbia | 15,920 | 7,065 | 42 | 0.005944798301 |
| Bennettsville | 8,833 | 3,057 | 19 | 0.006215243703 |
| Greenville | 62,252 | 25,649 | 203 | 0.007914538579 |
| Lancaster | 8,960 | 3,264 | 26 | 0.007965686275 |
| Clemson | 15,072 | 5,738 | 46 | 0.008016730568 |
| Florence | 37,961 | 14,972 | 121 | 0.008081752605 |
| Orangeburg | 13,553 | 4,939 | 49 | 0.009921036647 |
| Summerville | 46,974 | 16,492 | 164 | 0.009944215377 |
| Mauldin | 24,823 | 9,407 | 96 | 0.01020516637 |
| Hartsville | 7,852 | 3,225 | 36 | 0.0111627907 |
| Camden | 7,030 | 2,917 | 33 | 0.0113129928 |
| Walterboro | 5,281 | 2,231 | 28 | 0.01255042582 |
| Sumter | 40,929 | 15,975 | 217 | 0.01358372457 |
| Moncks Corner | 9,460 | 3,092 | 47 | 0.01520051746 |
| Irmo | 11,893 | 4,382 | 70 | 0.01597444089 |
| Columbia | 132,067 | 45,112 | 792 | 0.01755630431 |
| Cayce | 12,951 | 5,331 | 119 | 0.02232226599 |
| Conway | 20,175 | 6,344 | 165 | 0.02600882724 |
| North Augusta | 22,300 | 9,051 | 265 | 0.02927853276 |
| Forest Acres | 10,603 | 5,079 | 151 | 0.02973026186 |
| Goose Creek | 40,370 | 12,541 | 377 | 0.03006139861 |
| Bluffton | 15,199 | 4,473 | 141 | 0.03152246814 |
| North Charleston | 106,749 | 36,384 | 1,667 | 0.04581684257 |
| Hanahan | 19,865 | 7,295 | 820 | 0.1124057574 |
| Georgetown | 9,054 | 3,416 | 528 | 0.1545667447 |
| Port Royal | 11,870 | 2,576 | 399 | 0.1548913043 |
| Beaufort | 13,130 | 4,532 | 1,514 | 0.3340688438 |
| Charleston | 130,113 | 51,591 | 23,697 | 0.4593243008 |
| Mount Pleasant | 77,796 | 27,914 | 14,591 | 0.5227126173 |
| Myrtle Beach | 29,992 | 11,776 | 10,329 | 0.877122962 |
| Hilton Head Island | 40,039 | 16,781 | 28,025 | 1.670043502 |
| North Myrtle Beach | 15,174 | 7,256 | 12,532 | 1.727122381 |
Data sources: U.S. Census Bureau, National Flood Insurance Program
Data notes
Population estimates as of July 1, 2014
Household figures for 2009-2013
Flood insurance figures as of July 31, 2015