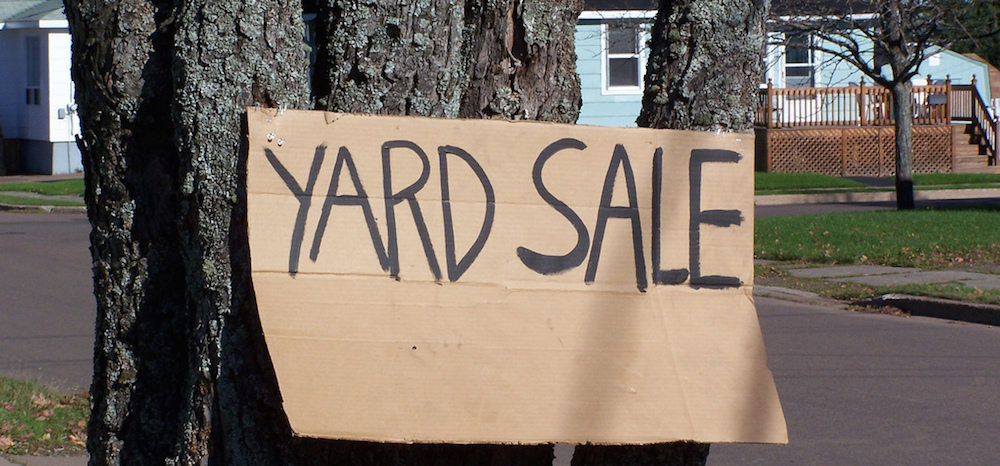
Your yard is a potential goldmine. Well, not necessarily the yard itself, but what you put on your yard.
Each week, Americans hold an estimated 165,000 yard sales, also known as garage sales, according to Statistic Brain. And each week, buyers snap up close to 5 million items — lawn mowers, leather recliners and baby clothes, for instance — at those sales, Statistic Brain says. Over a year’s time, according to the website, these sales generate nearly $220 million in revenue.
Photo: Flickr/Janet Lackey
Yard sale pros know that in order to pull in the most customers and the most revenue, your best bet is to conduct a sale on a Saturday. But whether you’re a buyer or a seller, do you know how yard sale-friendly your community is?
To answer that question, we looked at five pieces of data for the 100 most populated metro areas in the U.S.:
- Median household income, an indicator of the spending power of potential shoppers. For this factor, a higher number is better.
- Buying power, an indicator of how much income remains after covering various expenses. For this factor, a higher number is better.
- Home ownership rate, an indicator of how many folks actually are able to stage yard sales. For this factor, a higher number is better.
- Summertime heat index, an indicator of favorable or unfavorable weather conditions during peak yard-sale season. For this factor, a lower number is better.
- Yard sales per 100 people, an indicator of how robust the market is for these sales. For this factor, a higher number is better. (Note: We used statewide figures; metro-level figures weren’t available.)
Photo: Flickr/Port Foliolongo
After compiling that data, we evenly weighted each of the five factors to generate a score for every one of the 100 metro areas. The higher the score, the better a metro area is for yard sales; the top score is 10.
“Yard sales are an American tradition,” says Ryan Farley, co-founder and chief operating officer of LawnStarter. “By creating our list of the 16 Best Metro Areas for Yard Sales, we hope buyers and sellers in these regions will appreciate the community-minded atmosphere that bolsters this old-school phenomenon — a phenomenon that’s growing thanks to online sale listings and social media networks like Pinterest.”
Here is LawnStarter’s list of the 16 Best Metro Areas for Yard Sales.
1. Denver, CO
Photo: Lowry
Yard sale score: 7.845
Median household income: $75,962
Buying power: 95.4
Home ownership rate: 74.6%
Summertime heat index: 74.1
Yard sales per 100 people: 1.99
2. Seattle, WA
Photo: Capitol Hill Seattle Blog
Are you a Seattleite in need of lawn service? Check out our Seattle lawn service page!
Yard sale score: 7.749
Median household income: $78,355
Buying power: 93.4
Home ownership rate: 73%
Summertime heat index: 74.1
Yard sales per 100 people: 1.96
3. Omaha, NE
Screen shot: YouTube/WOWT
Yard sale score: 7.266
Median household income: $72,731
Buying power: 106
Home ownership rate: 77.8%
Summertime heat index: 83.6
Yard sales per 100 people: 1.39
4. Spokane, WA
Screen shot: KHQ
Yard sale score: 7.198
Median household income: $77,627
Buying power: 104.5
Home ownership rate: 62.8%
Summertime heat index: 72.6
Yard sales per 100 people: 1.96
5. Boise, ID
Photo: Ben Towne Foundation
Yard sale score: 7.102
Median household income: $60,357
Buying power: 105.6
Home ownership rate: 71.0%
Summertime heat index: 77.8
Yard sales per 100 people: 2.25
6. Grand Rapids, MI
Photo: Fox 17
Yard sale score: 7.069
Median household income: $65,310
Buying power: 107.1
Home ownership rate: 69.0%
Summertime heat index: 78
Yard sales per 100 people: 1.7
7. Portland, OR
Photo: Follow Me Foodie
Yard sale score: 6.950
Median household income: $68,800
Buying power: 99.3
Home ownership rate: 67.6%
Summertime heat index: 72.6
Yard sales per 100 people: 3.02
8. Youngstown, OH
Screen shot: WKBN
Yard sale score: 6.815
Median household income: $58,683
Buying power: 112.7
Home ownership rate: 73.9%
Summertime heat index: 78.1
Yard sales per 100 people: 1.28
9. Minneapolis-St. Paul, MN
Photo: Southwest Journal
Yard sale score: 6.797
Median household income: $78,676
Buying power: 97.4
Home ownership rate: 69.6%
Summertime heat index: 79.7
Yard sales per 100 people: 1.58
10. Cleveland, OH
Screen shot: WEWS
Yard sale score: 6.775
Median household income: $67,598
Buying power: 111.7
Home ownership rate: 69.2%
Summertime heat index: 80
Yard sales per 100 people: 1.28
11. Milwaukee, WI
Photo: Urban Milwaukee
Yard sale score: 6.770
Median household income: $68,056
Buying power: 105
Home ownership rate: 66.2%
Summertime heat index: 7.86
Yard sales per 100 people: 1.9
12. Cincinnati, OH
Screen shot: WCPO
Yard sale score: 6.679
Median household income: $71,770
Buying power: 110.5
Home ownership rate: 69.2%
Summertime heat index: 83
Yard sales per 100 people: 1.28
13. Providence, RI
Photo: Summit Neighborhood Association
Yard sale score: 6.620
Median household income: $67,875
Buying power: 100.7
Home ownership rate: 68.9%
Summertime heat index: 79.5
Yard sales per 100 people: 1.79
14. Wichita, KS
Photo: KAKE
Yard sale score: 6.498
Median household income: $65,717
Buying power: 109.5
Home ownership rate: 73.9%
Summertime heat index: 88
Yard sales per 100 people: 1.52
15. Colorado Springs, CO
Photo: Colorado Springs DeMolay
Yard sale score: 6.470
Median household income: $66,472
Buying power: 100.6
Home ownership rate: 65.4%
Summertime heat index: 70.2
Yard sales per 100 people: 1.99
16. Columbus, OH
Photo: TourismOhio
Yard sale score: 6.319
Median household income: $72,044
Buying power: 107
Home ownership rate: 67.4%
Summertime heat index: 81.6
Yard sales per 100 people: 1.28
Data sources
http://www.pewsocialtrends.org/2016/05/11/americas-shrinking-middle-class-a-close-look-at-changes-within-metropolitan-areas/
https://github.com/TaxFoundation/data/tree/master/real-purchasing-power/current
http://www.jchs.harvard.edu/
http://www.bertsperling.com/2013/07/02/sizzling-cities-ranked-our-new-heat-index/
http://www.prweb.com/releases/2016/03/prweb13256961.htm
https://www.census.gov/population/metro/data/
Top photo: Flickr/Rob Durdle


