
Wage, Salary, and Hourly Earnings Stats
Curated by Alan LaFrance
Published 1/12/2019
These statistics are curated from a United States Dept. of Labor Report, sourced below. The figures are the most up-to-date data available at the time of publishing, or the last update date, whichever is present.
According to the US Dept. of Labor, pest control workers
Total Yearly Pay, Wages, or Salary
| Average Yearly Wage | $36,610 |
| Average Yearly Wage vs US Average | -27.68% |
Pest Control Hourly Pay
| Median Hourly Wage | $16.39 |
| Average Hourly Wage | $17.60 |
Highest Pest Control Hourly Wages
| Top 10% of Earners Hourly Wage | $26.48 |
| Top 25% of Earners Hourly Wage | $21.10 |
| Top 10% of Earners Annual Wage | $55,080 |
| Top 25% of Earners Annual Wage | $43,890 |
| Highest Paying Industry (Avg) | Fed. Exec. Branch |
| HPI Hourly Average Wage | $26.50 |
| HPI Annual Average Wage | $55,110 |
Pest Control Employment Stats
| Workers | 75,130 |
| Percent of Total US Workers | 0.05% |
| Future Job Forecast | Up 8% (6,500 Jobs) |
Top 3 Industries by Employment
- Building & Dwelling Services
- Local Government
- Building Maintenance
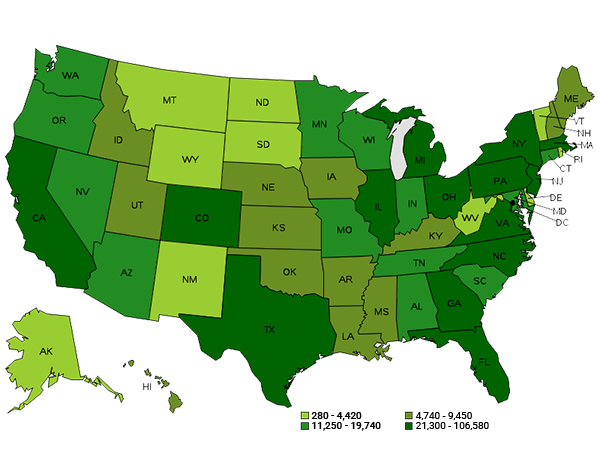
Top 5 States by Employment
- California (10,030 Employed)
- Florida (10,020 Employed)
- Texas (6,680 Employed)
- Georgia (4,320 Employed)
- North Carolina (3,560 Employed)
Pest Control Employment by State
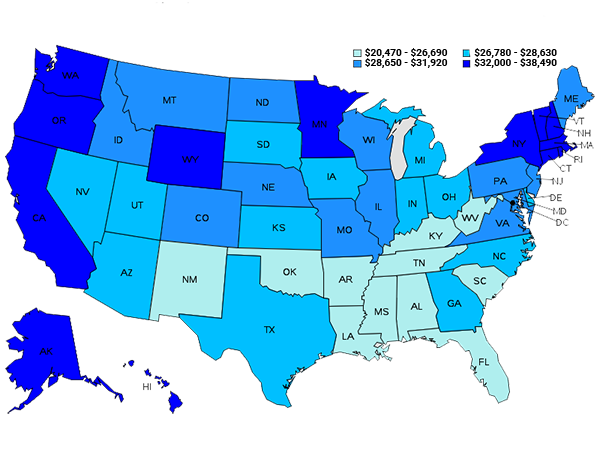
Highest Paying States
- Massachusetts ($47,280)
- Washington ($44,050)
- District of Columbia ($43,830)
- Nevada ($43,740)
- Iowa ($42,250)
Pest Control Wages by State
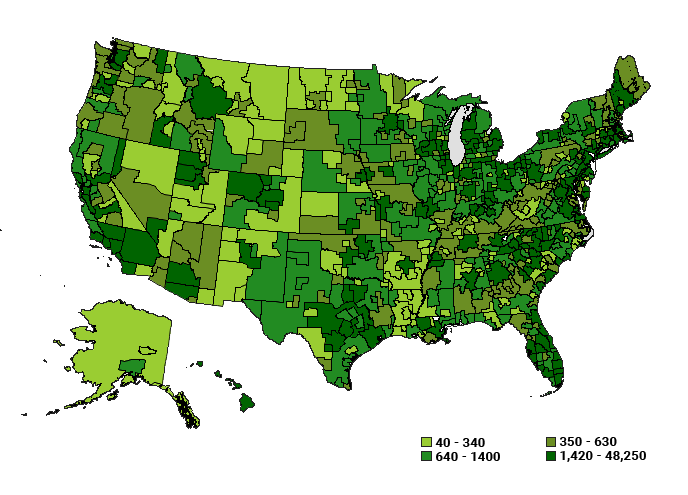
Top 5 Metros / Cities by Employment
- New York City, NY (24,260 Employed)
- Los Angeles, CA (17,930 Employed)
- Chicago, IL (16,640 Employed)
- Houston, TX (16,070 Employed)
- Atlanta, GA (14,830 Employed)
Pest Control Employment by Metro / City
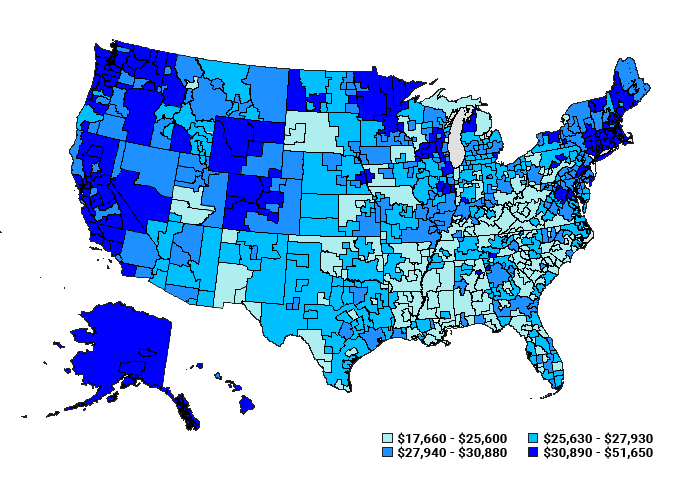
Highest Paying Metros / Cities
- Santa Rosa, CA ($25.59 / $53,230)
- San Jose, CA ($24.74 / $51,460)
- San Francisco, CA ($24.04 / $50,010)
- Killeen, TX ($22.98 / $47,790)
- Newark, NJ ($22.95 / $47,730)
Pest Control Worker Wages by Metro / City
Need a stat, but don’t see it here? Email us for quick assistance!
Sources
Bureau of Labor Statistics – May 2017 National Industry-Specific Occupational Employment and Wage Estimates
https://www.bls.gov/oes/2017/may/naics5_561730.htm