Employment Statistics

2023

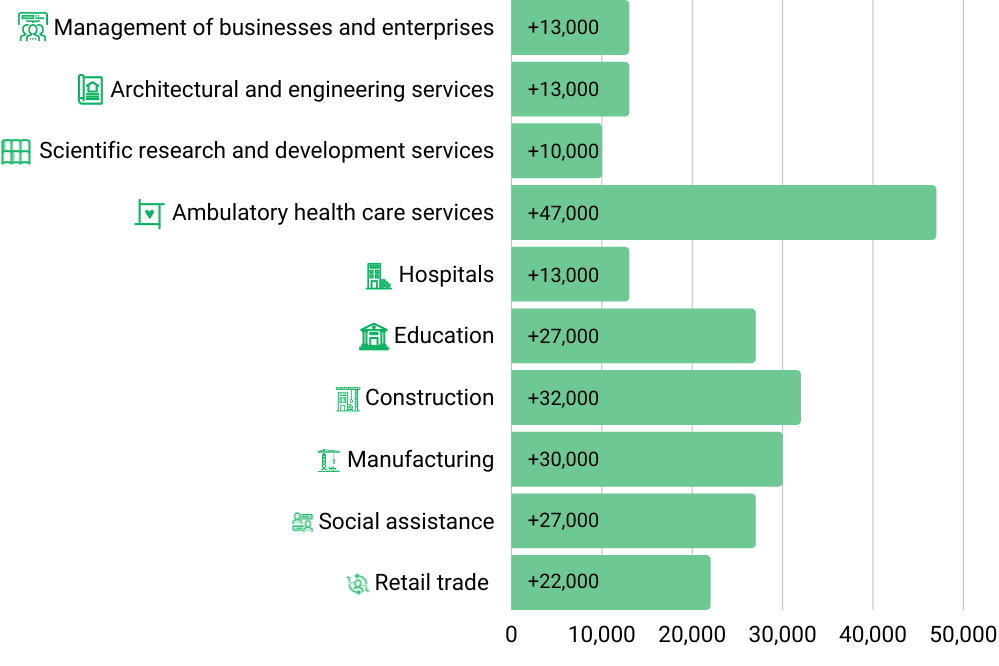
The second quarter of the U.S. labor market was marked by robust and consistent job growth. Nearly all sectors have recovered their employment levels as a result of broad-based job growth, but some have done so faster than others and now have employment levels that are higher than they were before the pandemic.

Topics Covered

Along with rapid job growth, job recovery has also been marked by increased employer demand for workers. However, the pandemic has likely caused certain irregularities in the labor market that could explain the assumption that businesses cannot fill open positions.


To get a better understanding of the current state of the employment statistics, LawnStarter has laid out some statistics for those who love numbers.

Key Findings

  • Global employment reached 3.32 billion in 2022.
  • The employment rate for the working-age population in the OECD increased to 69.5%
    in the first quarter of 2022.
  • Eighty percent (80%) of OECD countries had an increase in the employment rate.
  • U.S. saw a monthly job growth of 420,000 new jobs in September 2022. These job gains occurred mostly in leisure and hospitality (+83,000 new jobs) and health care (+60,000 new jobs).
  • Total nonfarm payroll employment in the U.S increased by 528,000 in July 2022.
  • In their prime working age (25-54), women’s participation in the labor force is 15% higher than that of men’s
  • Over the 2020–30 decade, total employment is expected to rise by 11.9 million,
    from 153.5 million jobs to 165.4 million.
  • Healthcare support jobs are expected to experience the fastest employment increase
    among all occupational groups.

Global Employment Statistics

0 .32 b

Global employment in 2022

0 %

Employment rate for the working-age population

0 %

of OECD countries had an increase in the employment rate

The rapid economic shock brought on by the coronavirus pandemic likely caused a considerable decline in global employment between 2019 and 2020, with the number of working people falling from 3.3 billion to 3.19 billion. Nonetheless, global employment reached 3.32 billion in 2022, up from 2.28 billion in 1991, or a rise of almost
1.04 billion individuals.

Besides the pandemic, the beginning of the Ukraine war caused the employer and labor force participation rates in the Organisation for Economic Co-operation and Development (OECD) to be at their most outstanding levels since the series’ inception in 2005 and 2008. The employment rate for the working-age population in the OECD, including workers and self-employed people, increased to 69.5% in the first quarter of 2022.

Eighty percent (80%) of OECD countries had an increase in the employment rate. In the first quarter of 2022, the OECD labor force participation of the working-age population—either employed or unemployed—hit 72.9%, surpassing the figure from the fourth quarter of 2019 for the first time.

U.S. Employment
Statistics

+528,00 0

Nonfarm payroll employment compared to February 2022

3.5 0 %

Unemployment rate for September 2022

Both the employment-population ratio (60%) and the labor force participation rate (62.3%) showed minimal change since June 2022. Both metrics are still below where they were in February 2020 (63.4% and 61.2%, respectively).


Additionally, the industries that saw the most job growth overall were hospitality, professional and business services, and health care. In July, 3.9 million people were working part time for economic reasons, different from February 2020 when there were 4.4 million. Due to their reduced hours or inability to acquire full-time employment, these people, who might prefer full-time employment, were forced to work part-time jobs.

0 million

People marginally tied to the labor force

0

Discouraged workers

Industry

Compared to February 2020, employment has increased in many industries, including

Employment status by gender and age

When it comes to gender and age, there seems to be a slight difference between men and women, with the first being 11.40% more likely to be employed at the age of 16 and above, and 11.64% more likely at the age of 20 and above. Similarly, when it comes to their prime working age (25-54), men are 12% more likely to be employed than women.

In their prime working age (25-54)

Men 85.9%
Women 74.2%

Employment Rate in the United States

Tens of thousands – sometimes even hundreds of thousands jobs, are added to the United States economy every year. Moreover, the U.S economy has seen job growth every month since 2010, averaging 223,000 new jobs in 2018 and 176,000 new jobs in 2019. These numbers spiked in July 2022, with 528,000 new jobs for Americans. The latest September 2022 data show a monthly job growth of 420,000. These job gains occurred mostly in leisure and hospitality (+83,000 new jobs) and health care(+60,000 new jobs).


However, the job market in the U.S. is not the same in the whole country, as each state has its industries and economies, causing the employment and unemployment rates to vary from state to state. When it comes to the states with the highest employment rates, South Carolina, Utah, Vermont, North Dakota, and Colorado lead the list.


On the other hand, Alaska, Mississippi, District of Columbia, West Virginia, and Louisiana have the lowest employment rates. Still, it’s worth mentioning that none of these states have an employment rate below 93.9%.

The Future of Employment

Over the 2020-2030 decade, total employment is expected to rise by


0 .9 million

This rise accounted for recovery from low base-year employment for 2020 caused by the COVID-19 pandemic and its attendant recession, reflecting an annual growth rate of 0.7 percent, which is greater than recent projection cycles. 


In contrast to the previous two decades, when Gross Domestic Product (GDP) expanded by 1.7% yearly, real GDP is estimated to rise by 2.3% annually from 2020 to 2030. In the meantime, it is anticipated that worker productivity will increase as well, from 1.1% over the 2010–20 decade to 1.7 % annually from 2020–30.

Effects of the COVID-19 Pandemic
on the 2020–30 Projections

From February to April 2020, because of the COVID-19 epidemic, there was a significant and abrupt drop in output and employment. These effects of the recession translate to lower base-year values than in prior predictions, resulting in higher predicted employment growth for the 2020–30 projections because 2020 serves as their base year.

As industrial output and employment return to normal levels and resume their long-term growth patterns, many industries are anticipated to undergo cyclical recoveries in the first half of the projected decade. A substantial increase is expected for the sectors whose employment decreased in 2020 and for the professions employed by those businesses.

In 2030, there will be 169.6 million people in the labor force, an 8.9 million rise from the 2020 level of 160.7 million. The expected labor force participation rate will fall from 61.7% in 2020 to 60.4% in 2030. The baby-boom generation is aging, men’s participation is continuing to fall, and women’s involvement is somewhat declining, all of which contribute to the decline in labor force participation. Healthcare support jobs are expected to experience the fastest employment increase among all occupational groups.