As anyone who’s visited knows, the Strip in Las Vegas, NV, is a hustle-and-bustle place. But it appears that professional and DIY movers in the Las Vegas area are hustling and bustling as well.
A LawnStarter study of data from the U.S. Census Bureau’s 2014 American Community Survey shows Las Vegas is the No. 1 on-the-move metro area among the 100 biggest metro areas in the U.S. The Census Bureau recently released a trove of data from the 2014 American Community Survey, including statistics on residential moves.
To come up with our rankings, we looked at two factors:
- The percentage of owners or renters who had moved into their homes in 2010 or later. For the Las Vegas area, that figure was 55.7 percent in 2014.
- The percentage of residents who had moved within the past year. For the Las Vegas area, that figure was 20.8 percent in 2014.
For our rankings, we evenly weighted each of the two factors.
At the bottom of this blog post is an interactive chart that lists our rankings of all 100 of the largest metro areas.

Homes at Lake Las Vegas in Henderson, NV.
Photo: LasVegasRealEstateHome.com
‘Influx’ of Residents
Alexis Bradley, a Realtor in Las Vegas, says that after the Great Recession hit, jobs in the hospitality, gambling and construction sectors dried up in Vegas, so a lot workers left the region to make money elsewhere. As such, the housing market tanked. But after the recession, people started moving to Vegas once again and the housing market began rebounding.
“By 2014, we had seen an influx of residents, and that has remained true for the past few years and continued to increase,” Bradley says.
That, in turn, has translated into a surge in moving activity in the Las Vegas area. For 2014, Las Vegas claimed the No. 3 spot on U-Haul’s list of the top 10 U.S. destination cities for DIY movers. (In U-Haul’s rankings for 2015, Las Vegas slipped to No. 6.)
The U-Haul ranking for 2014 was “yet one more important indicator that the Las Vegas economy continues to strengthen,” Jim Murren, chairman and CEO of MGM Resorts International, is quoted as saying on U-Haul’s website. “More people realize that Las Vegas is headed in the right direction, and they want to relocate here to enjoy the fruits of a successfully recovering market.”
MGM Resorts is the largest employer in Nevada.

This graph shows the 2000-2016 rollercoaster ride of the Las Vegas home market.
Stable But Tight Housing Market
Reflecting the moving surge, Las Vegas area’s housing market is tight, with a less than three-month supply of homes available for sale, according to the Greater Las Vegas Association of Realtors. A home market with a six-month supply is considered “balanced.”
“The local housing market continues to be as stable as it has been in many years,” Scott Beaudry, president of the Greater Las Vegas Association of Realtors, said in April.
America’s 12 Most On-the-Move Metros
With an economically healthier Las Vegas leading the way, here is our list of America’s 12 Most On-the-Move Metros, based on estimates from the Census Bureau’s 2014 American Community Survey.
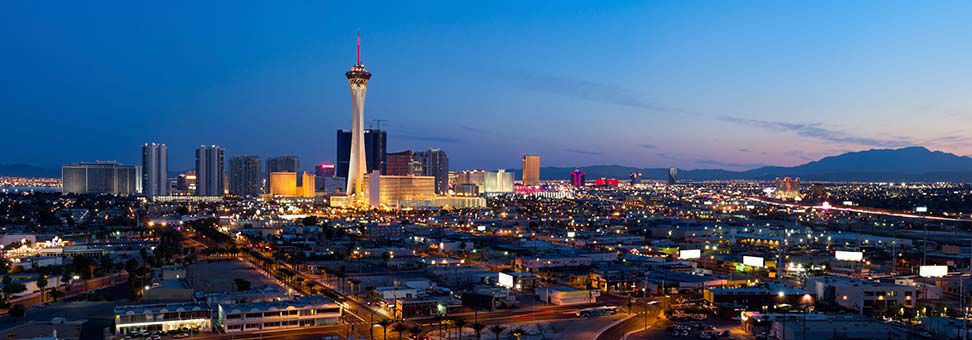
1. Las Vegas, NV

Photo: World Property Journal
Percentage of owners or renters who moved into their home in 2010 or later: 55.72%
Percentage of residents who moved within the past year: 20.8%
2. Austin, TX

Photo: Cirrus Logic
Percentage of owners or renters who moved into their home in 2010 or later: 51.39%
Percentage of residents who moved within the past year: 20.1%
3. Colorado Springs, CO

Photo: Springs Homes
Percentage of owners or renters who moved into their home in 2010 or later: 47.24%
Percentage of residents who moved within the past year: 23.8%
4. Phoenix, AZ

Photo: Flickr/Jerry Ferguson
Percentage of owners or renters who moved into their home in 2010 or later: 50.88%
Percentage of residents who moved within the past year: 18.1%
5. Tucson, AZ

Photo: City of Tucson
Percentage of owners or renters who moved into their home in 2010 or later: 46.16%
Percentage of residents who moved within the past year: 21.7%
6. Provo, UT

Photo: Avalanche Consulting
Percentage of owners or renters who moved into their home in 2010 or later: 45.57%
Percentage of residents who moved within the past year: 20.1%
7. Cape Coral-Fort Myers, FL

Photo: VincentBuenfil.com
Percentage of owners or renters who moved into their home in 2010 or later: 48.17%
Percentage of residents who moved within the past year: 17.3%
8. Denver, CO

Photo: McStain
Percentage of owners or renters who moved into their home in 2010 or later: 46.02%
Percentage of residents who moved within the past year: 18.8%
9. Orlando, FL

Photo: Flickr/Jeff Krause
Percentage of owners or renters who moved into their home in 2010 or later: 47.92%
Percentage of residents who moved within the past year: 16.7%
10. Durham-Chapel Hill, NC

Photo: Durham Convention & Visitors Bureau
Percentage of owners or renters who moved into their home in 2010 or later: 44.23%
Percentage of residents who moved within the past year: 19.9%
11. Stockton, CA

Photo: Visit Stockton
Percentage of owners or renters who moved into their home in 2010 or later: 47.22%
Percentage of residents who moved within the past year: 16.6%
12. Dallas-Fort Worth, TX

Photo: Flickr/Daxis
Percentage of owners or renters who moved into their home in 2010 or later: 46.62%
Percentage of residents who moved within the past year: 17%
Copy & paste the code below onto your site!

![6 Best Garden Hoes of 2024 [Reviews]](https://www.lawnstarter.com/blog/wp-content/plugins/related-posts/static/thumbs/2.jpg)